Grade 8 National Score Analysis
Key percentile cutoffs and distribution overview for the January 2026 ICMC results.
Top 1%
≥ 84
Top 5%
≥ 71
Top 10%
≥ 61
Top 25%
≥ 50
Five-Number Summary
| Minimum | Q1 (25%) | Median | Q3 (75%) | Maximum |
|---|---|---|---|---|
| 0 | 25 | 35 | 50 | 96 |
Normalized Score Distribution
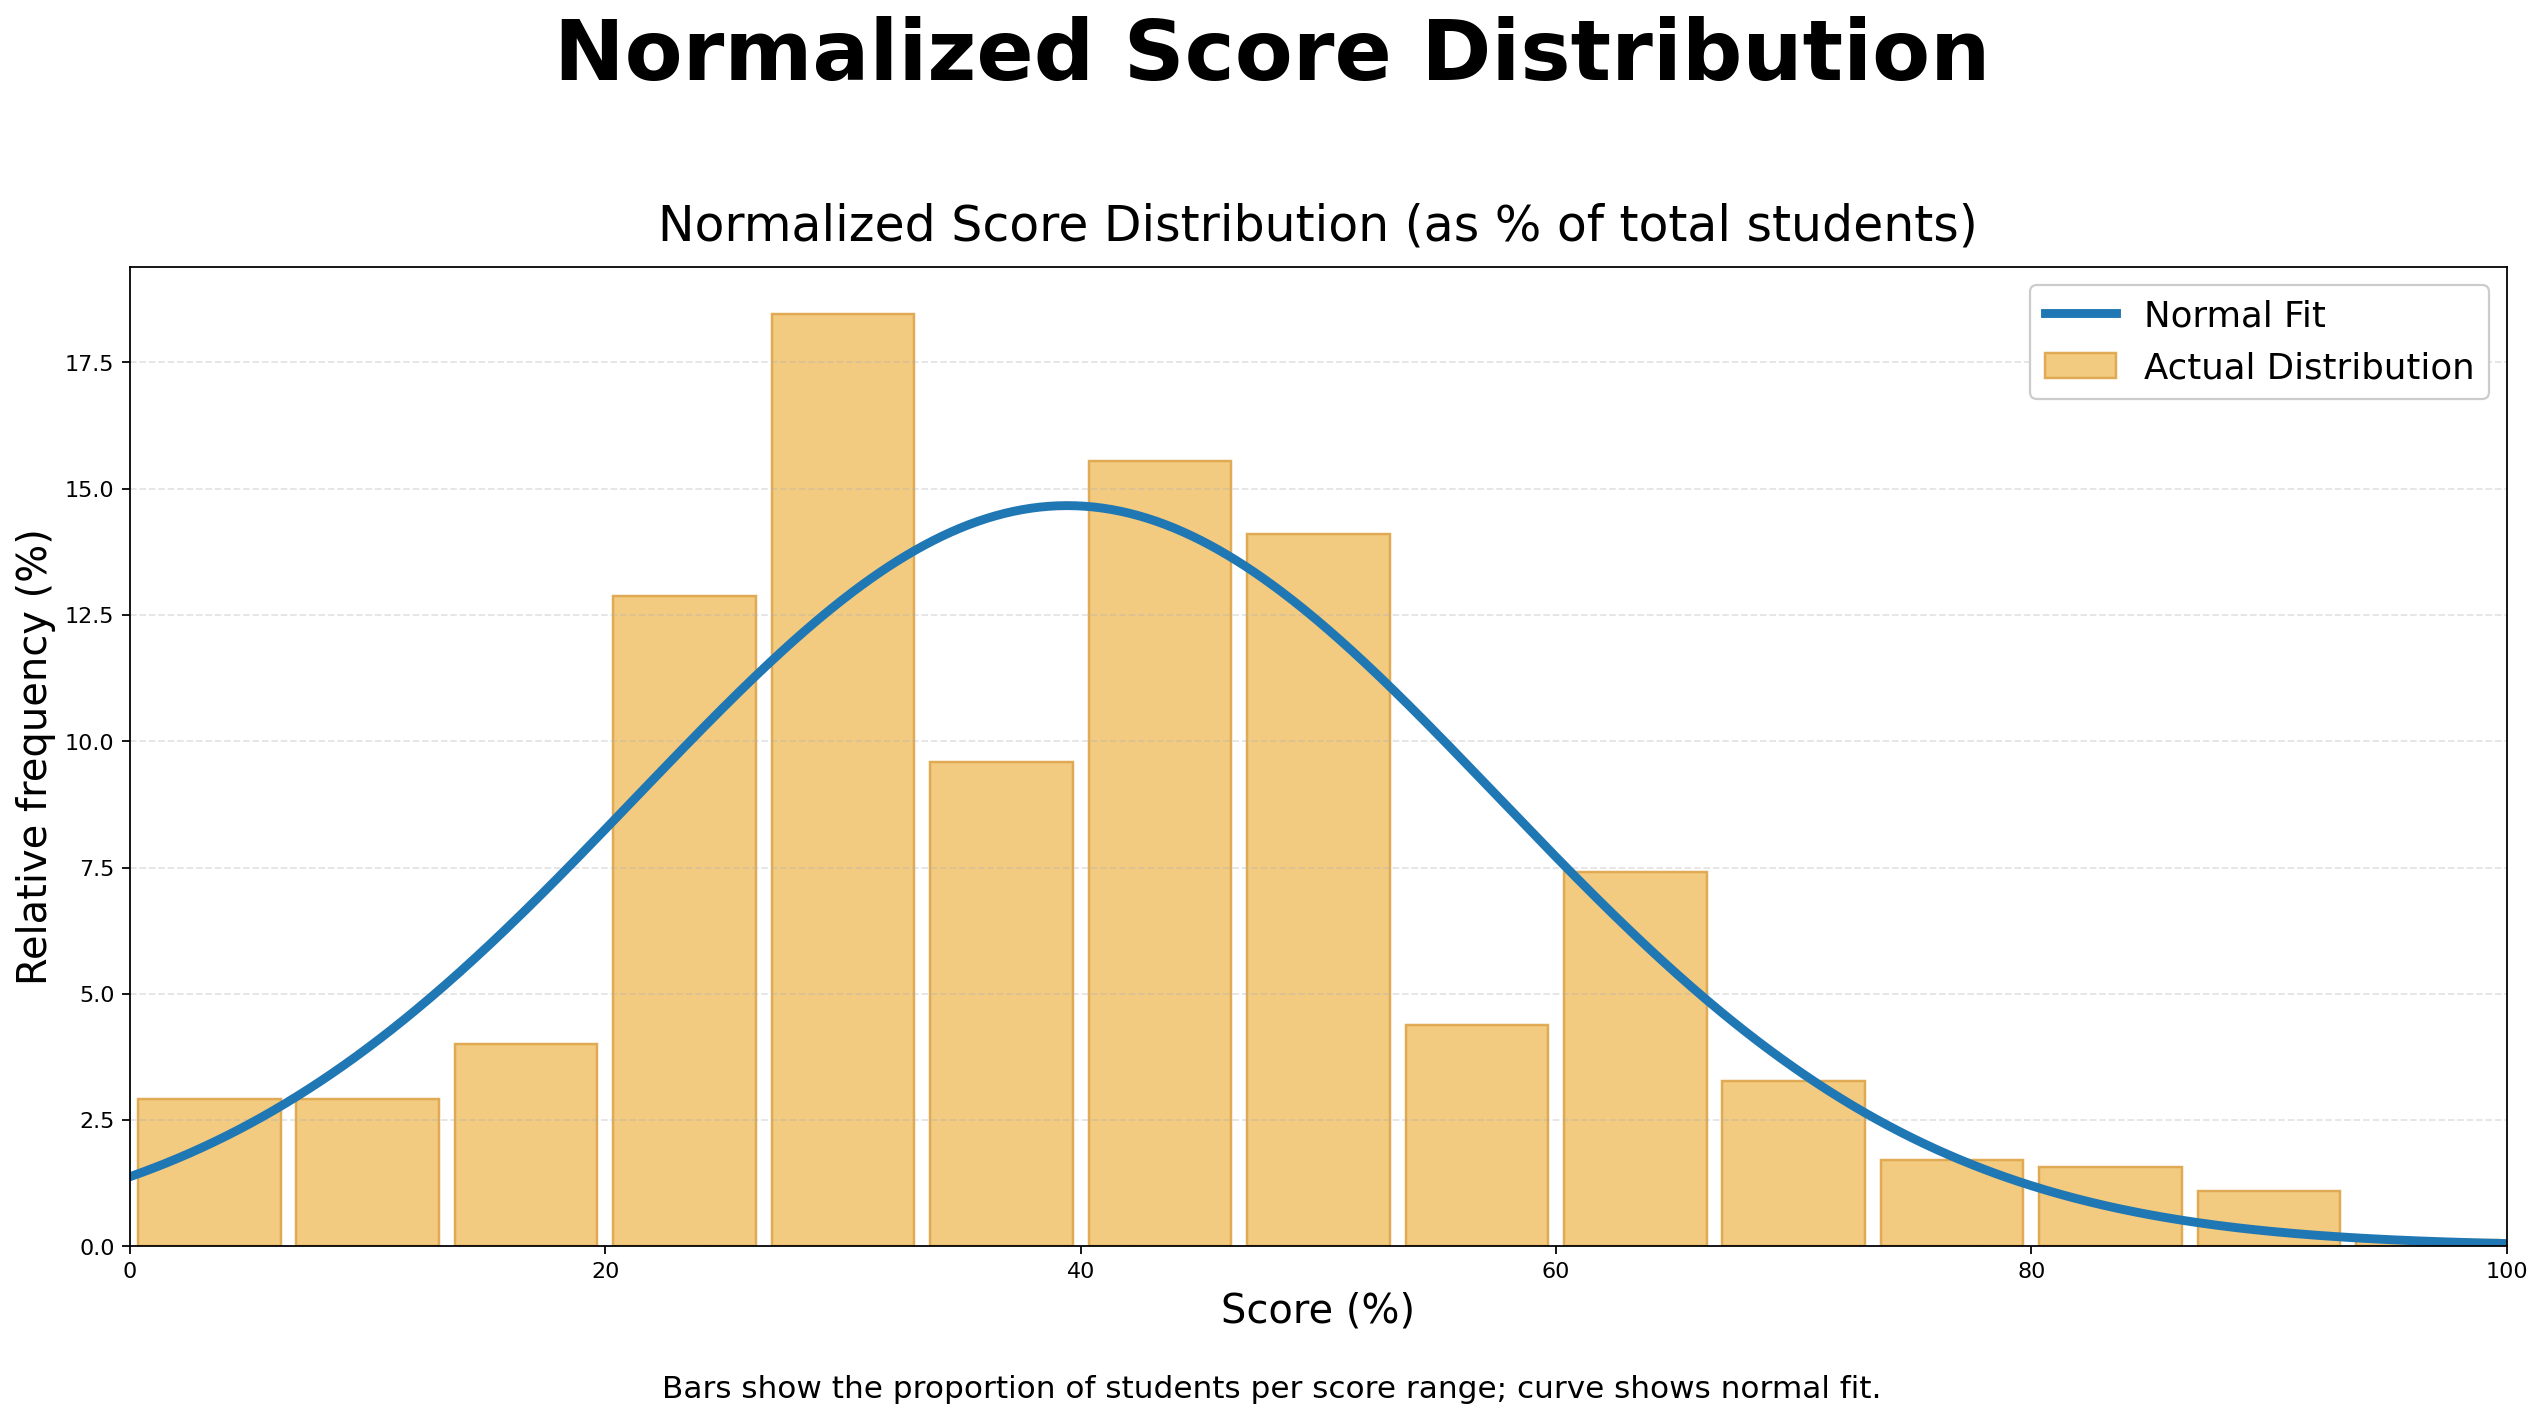
Bars show the proportion of students per score range; curve shows normal fit.
Grade 8 Top 10 Math Stars
| Rank | Student | School | City | Province/State | Country |
|---|---|---|---|---|---|
| 1 | Anindita M. | Clarington Central Intermediate School | Bowmanville | Ontario | Canada |
| 2 | Suha M. | Safa And Marwa | Mississauga | Ontario | Canada |
| 3 | Vedant P. | George Street Middle School | Fredericton | New Brunswick | Canada |
| 4 | Ammar O. | Safa And Marwa | Mississauga | Ontario | Canada |
| 5 | Fatemeh S. | Safa And Marwa | Mississauga | Ontario | Canada |
| 6 | Carson | Turnbull School | Ottawa | Ontario | Canada |
| 7 | Miller S. | Pineland P.S. | Burlington | Ontario | Canada |
| 8 | Kirk | Turnbull School | Ottawa | Ontario | Canada |
| 9 | Aadhya D. | Math Competition Coaching | Ashburn | Virginia | USA |
| 10 | Brendan | Turnbull School | Ottawa | Ontario | Canada |