Grade 4 National Score Analysis
Key percentile cutoffs and distribution overview for the January 2026 ICMC results.
Top 1%
≥ 86
Top 5%
≥ 72
Top 10%
≥ 63
Top 25%
≥ 50
Five-Number Summary
| Minimum | Q1 (25%) | Median | Q3 (75%) | Maximum |
|---|---|---|---|---|
| 0 | 27 | 36 | 50 | 100 |
Normalized Score Distribution
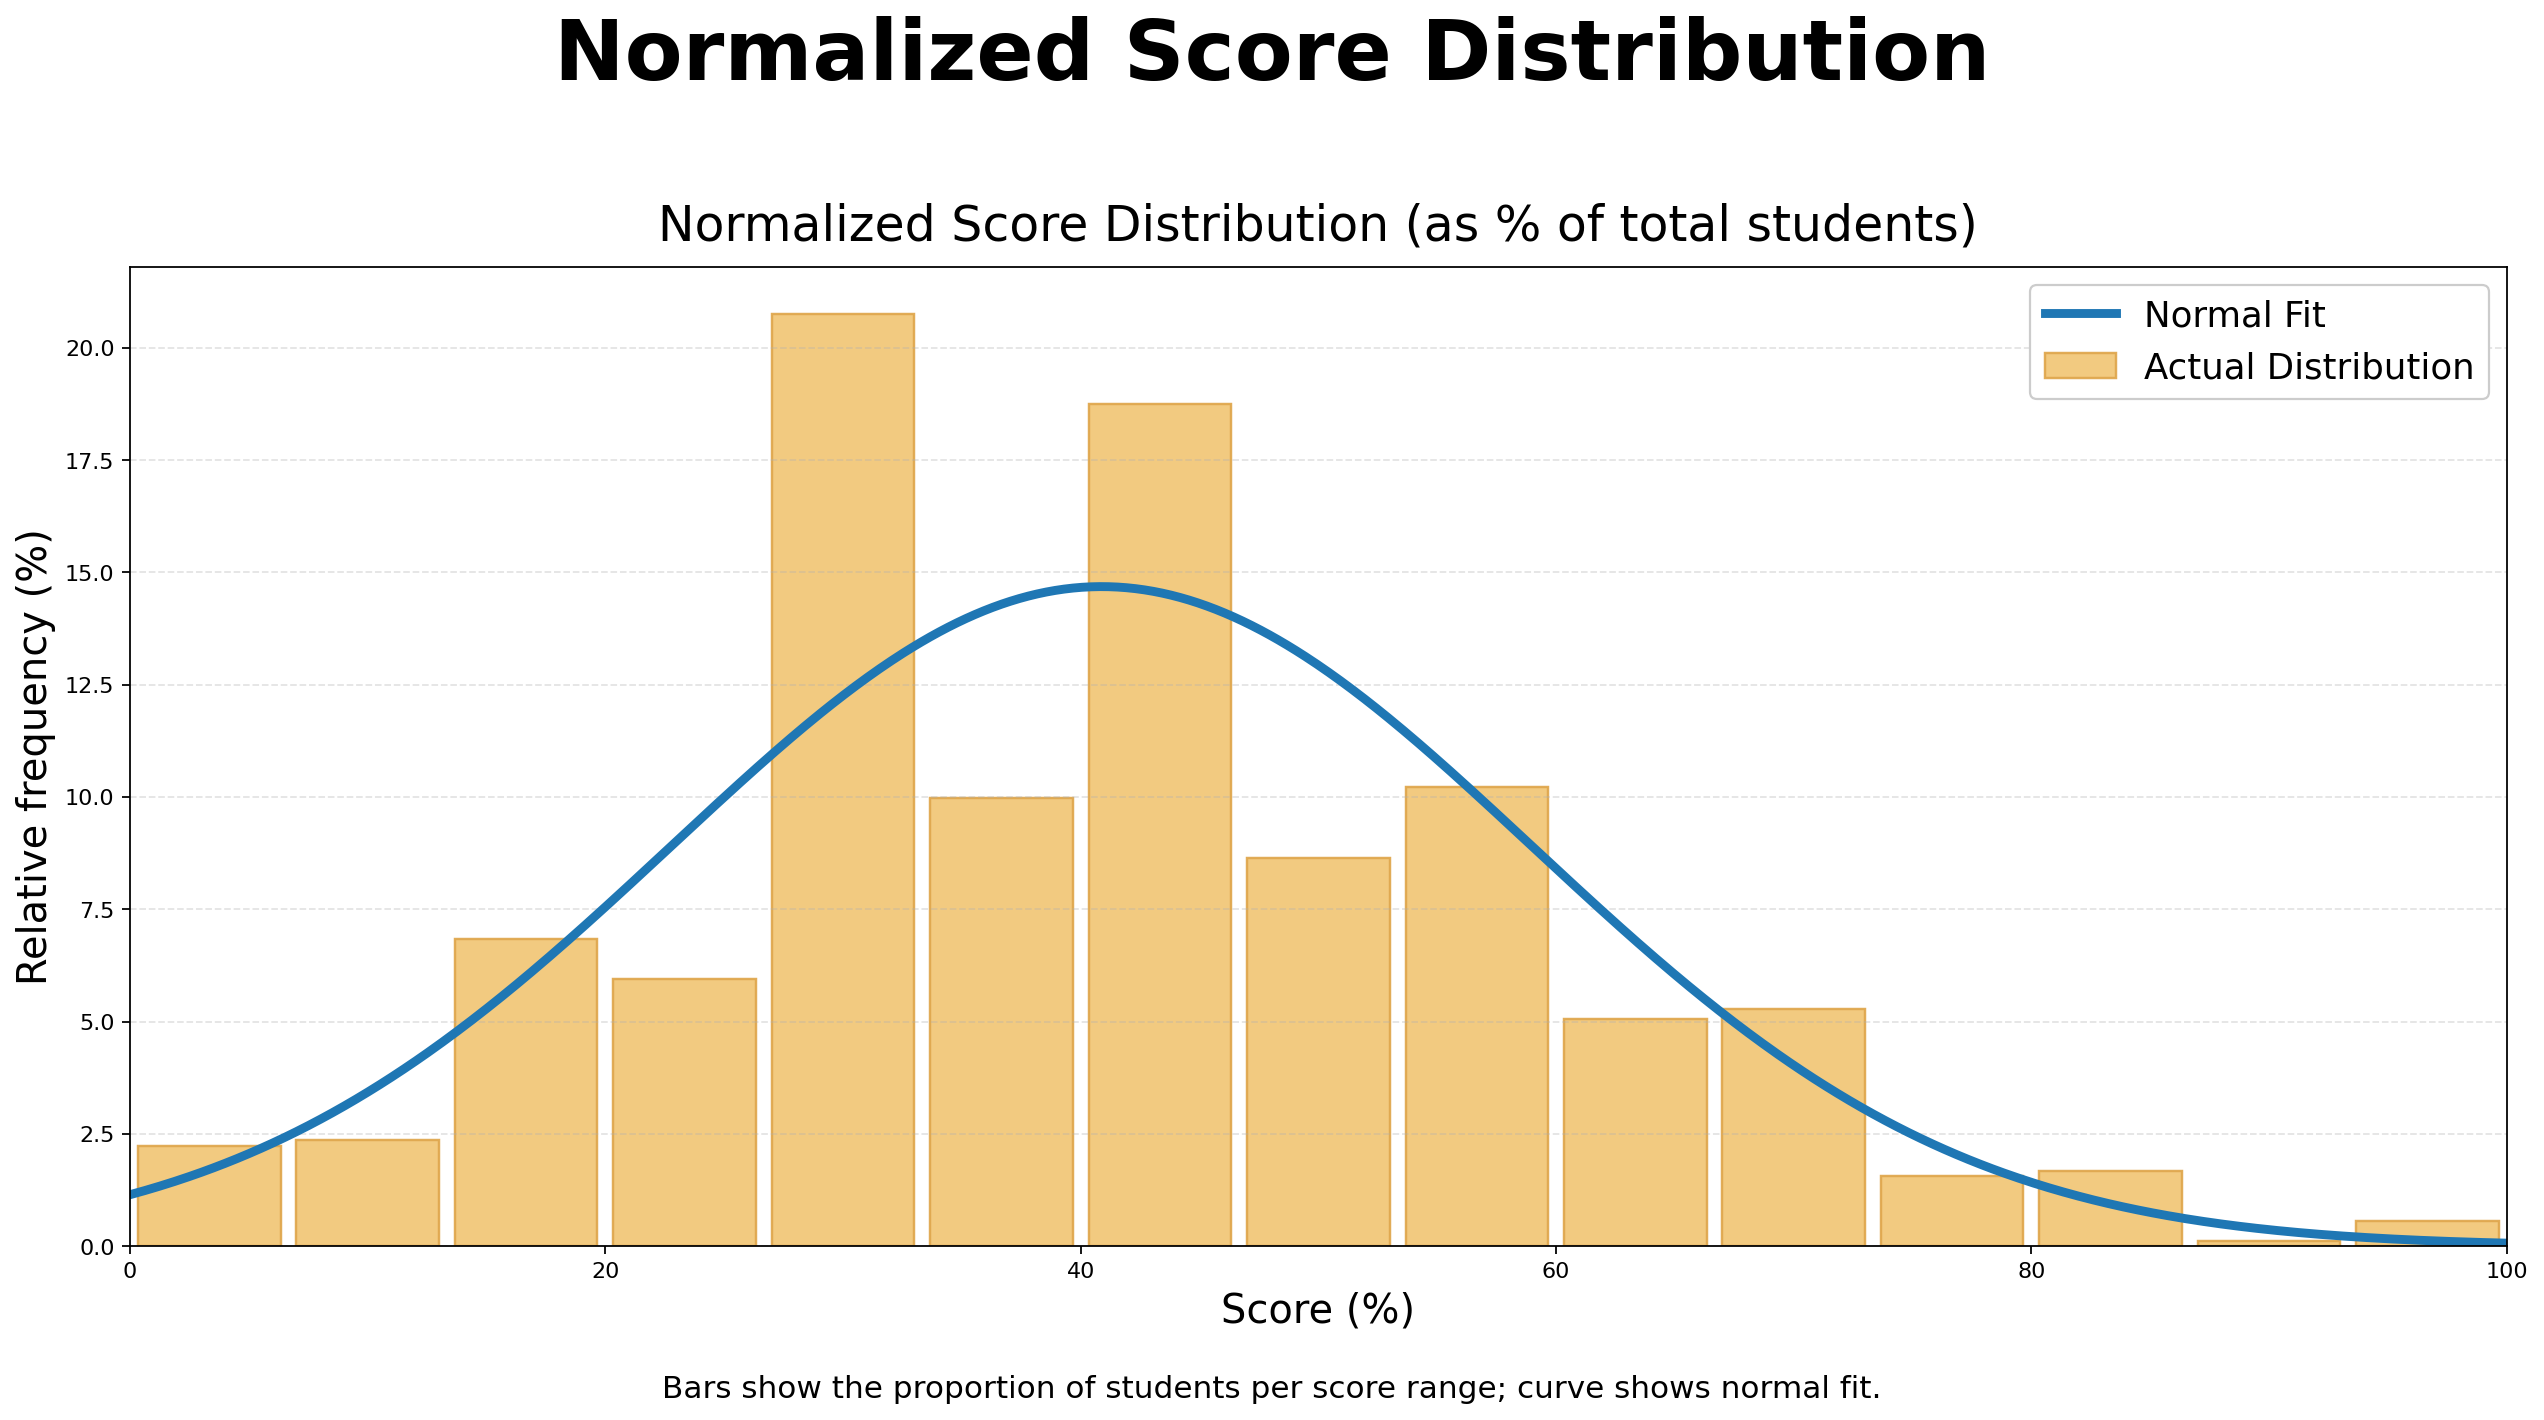
Bars show the proportion of students per score range; curve shows normal fit.
Grade 4 Top 10 Math Stars
| Rank | Student | School | City | Province/State | Country |
|---|---|---|---|---|---|
| 1 | Vismaya S. | Math Competition Coaching | Ashburn | Virginia | USA |
| 2 | Yuna L. | Sandwich West Public School | Lasalle | Ontario | Canada |
| 3 | Shanaya G. | Math Competition Coaching | Ashburn | Virginia | USA |
| 4 | Mohamed E. K. | Safa And Marwa | Mississauga | Ontario | Canada |
| 5 | Aryan K. | Willowbrook Elementary School | Bentonville | Arkansas | USA |
| 6 | Rayden T. | Collingwood School | West Vancouver | British Columbia | Canada |
| 7 | Ayden A. | New Horizons School | Sherwood Park | Alberta | Canada |
| 8 | Caleb M. | Leo Baeck Day School | Toronto | Ontario | Canada |
| 9 | Lucas S. | Collingwood School | West Vancouver | British Columbia | Canada |
| 10 | Romeo L. | Collingwood School | West Vancouver | British Columbia | Canada |
| 11 | Sebastian K. | St. Marguerite D’Youville | Oakville | Ontario | Canada |