Grade 2 National Score Analysis
Key percentile cutoffs and distribution overview for the May 2026 ICMC results.
Top 1%
≥ 72
Top 5%
≥ 62
Top 10%
≥ 56
Top 25%
≥ 43
Five-Number Summary
| Minimum | Q1 (25%) | Median | Q3 (75%) | Maximum |
|---|---|---|---|---|
| 0 | 21 | 32 | 43 | 94 |
Normalized Score Distribution
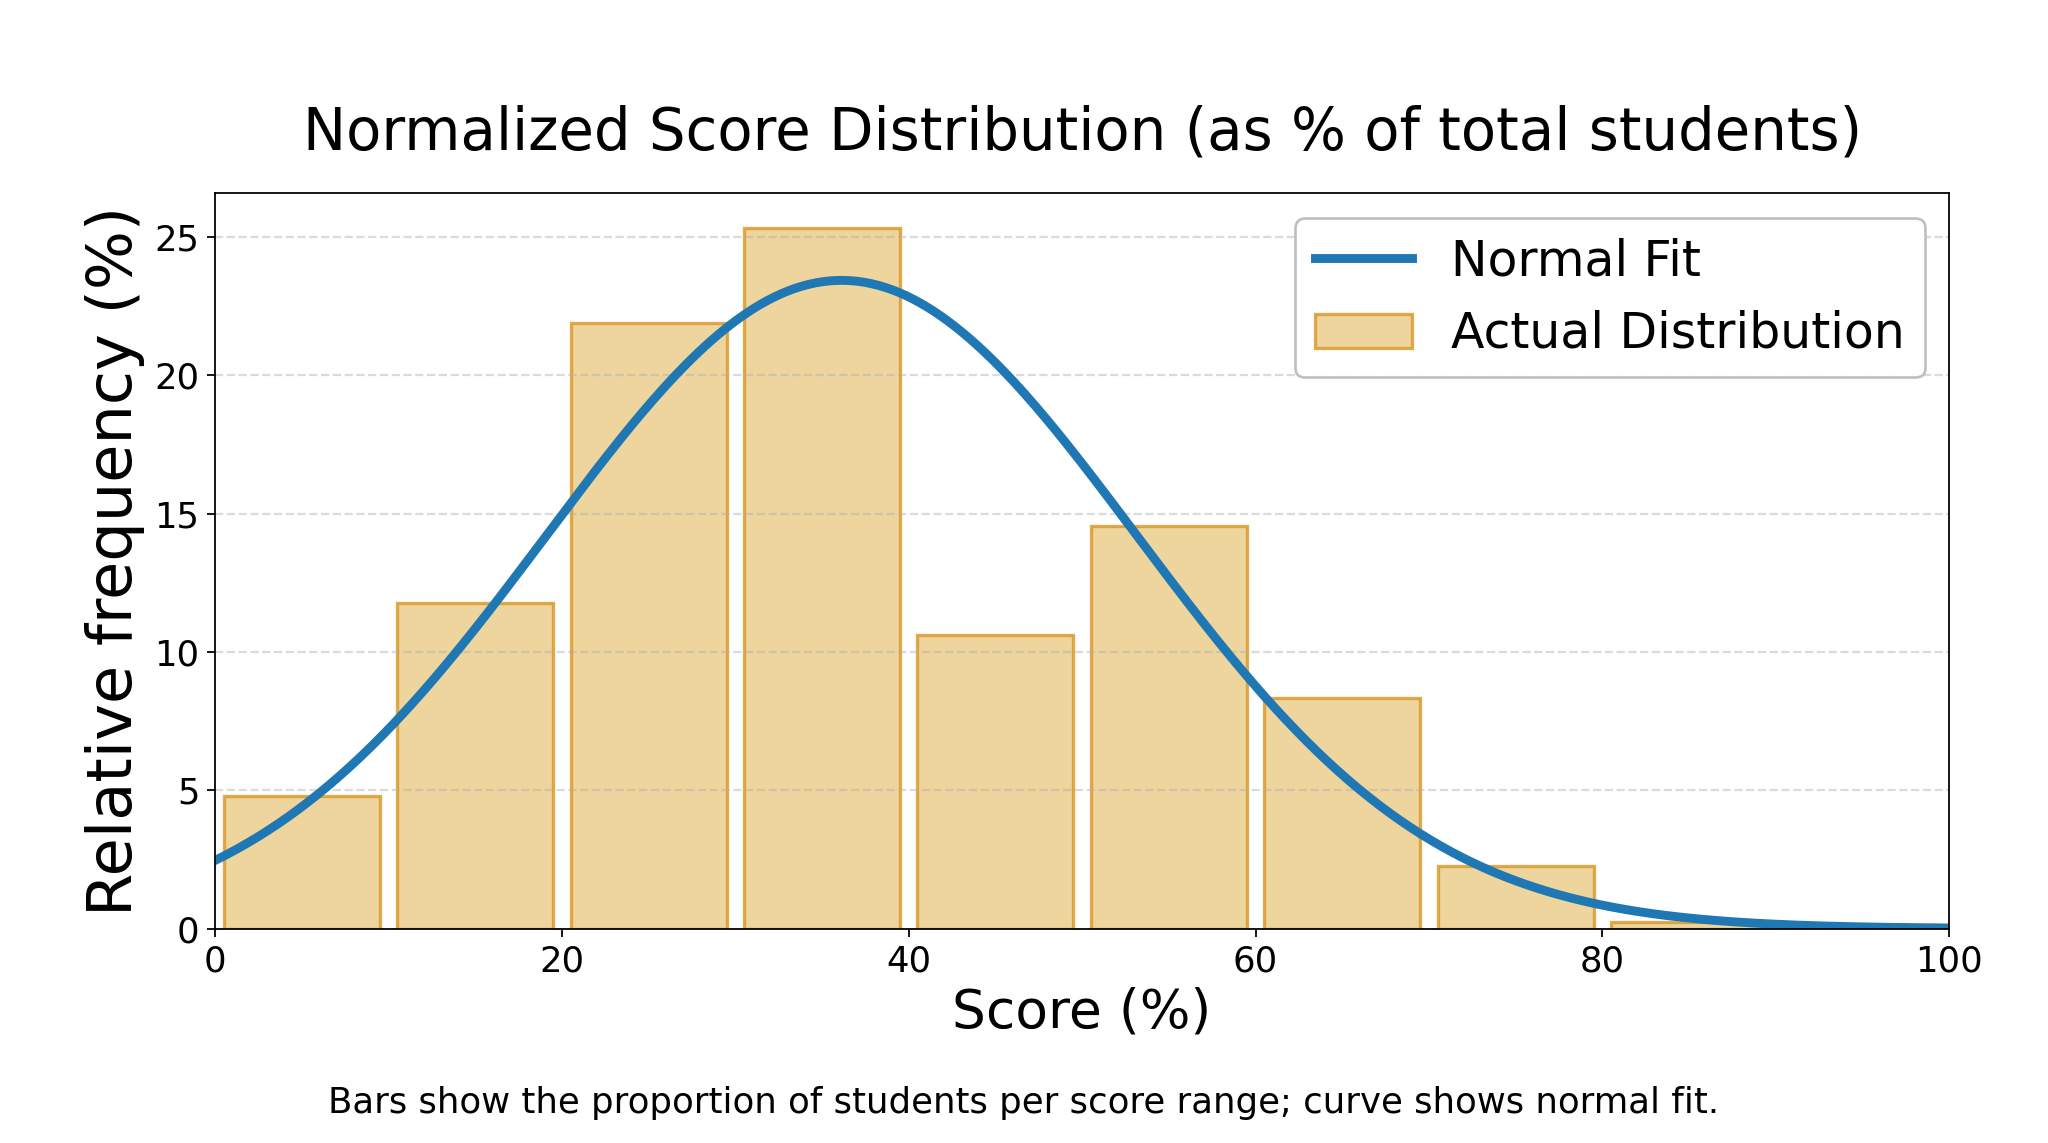
Bars show the proportion of students per score range; curve shows normal fit.
Grade 2 Top Math Stars
| Rank | Student | School | City | Province/State | Country |
|---|---|---|---|---|---|
| 1 | Nawab S. | Southwood Public School | Windsor | Ontario | Canada |
| 2 | Austin M. | Collingwood School | West Vancouver | British Columbia | Canada |
| 3 | Yasmin D. | New Horizons School | Sherwood Park | Alberta | Canada |
| 4 | Luka C. | Queen Of All Saints Elementary School | Coquitlam | British Columbia | Canada |
| 5 | Charlotte W. | Queen Of All Saints Elementary School | Coquitlam | British Columbia | Canada |
| 6 | Matti E. | Queen Of All Saints Elementary School | Coquitlam | British Columbia | Canada |
| 7 | Angfe S. | Mulgrave School | West Vancouver | British Columbia | Canada |
| 8 | Raymond W. | Mount Pleasant school | Edmonton | Alberta | Canada |
| 9 | Evelyn C. | Aurora Prep Academy | Aurora | Ontario | Canada |
| 10 | Jordan P. | Hawthorn Public School | Mississauga | Ontario | Canada |