Grade 8 National Score Analysis
Key percentile cutoffs and distribution overview for the May 2026 ICMC results.
Top 1%
≥ 84
Top 5%
≥ 64
Top 10%
≥ 56
Top 25%
≥ 39
Five-Number Summary
| Minimum | Q1 (25%) | Median | Q3 (75%) | Maximum |
|---|---|---|---|---|
| 0 | 12 | 25 | 39 | 96 |
Normalized Score Distribution
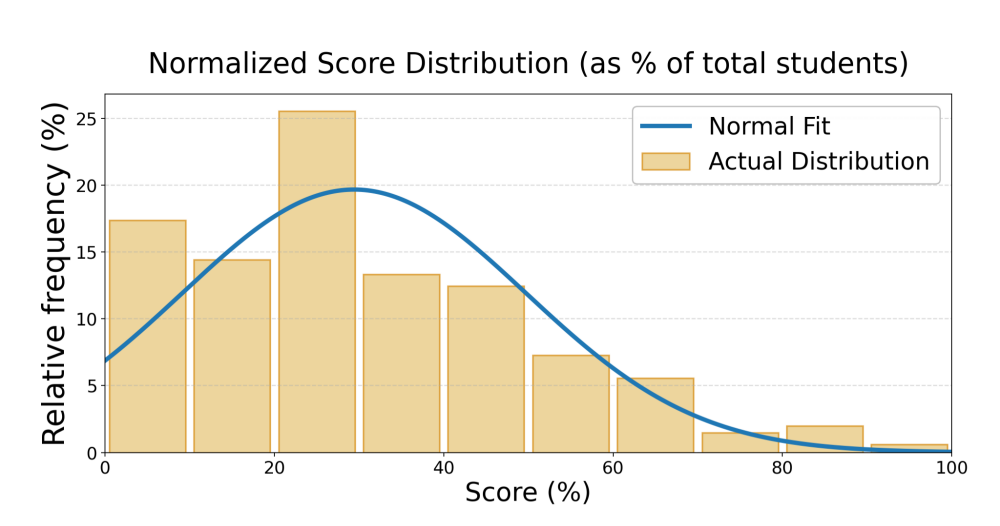
Bars show the proportion of students per score range; curve shows normal fit.
Grade 8 Top Math Stars
| Rank | Student | School | City | Province/State | Country |
|---|---|---|---|---|---|
| 1 | Marissa G. | Sandwich West Public School | Lasalle | Ontario | Canada |
| 2 | Reuben | Turnbull School | Ottawa | Ontario | Canada |
| 3 | Isaiah W. | Sandwich West Public School | Lasalle | Ontario | Canada |
| 4 | Rhea S. | Math Competition Coaching | Ashburn | Virginia | USA |
| 5 | Zain | Turnbull School | Ottawa | Ontario | Canada |
| 6 | Aariz A. | Académie Ste-Cécile International School | Windsor | Ontario | Canada |
| 7 | Fatemeh S. | Safa And Marwa | Mississauga | Ontario | Canada |
| 8 | Ridhi C. | Math Competition Coaching | Ashburn | Virginia | USA |
| 9 | Aadhya D. | Math Competition Coaching | Ashburn | Virginia | USA |
| 10 | Darren Y. | White Rock Christian Academy | Surrey | British Columbia | Canada |