
Grade 6 National Score Analysis
Key percentile cutoffs and distribution overview for the October 2026 ICMC results.
Top 1%
≥ 92
Top 5%
≥ 80
Top 10%
≥ 72
Top 25%
≥ 56
Five-Number Summary
| Minimum | Q1 (25%) | Median | Q3 (75%) | Maximum |
|---|---|---|---|---|
| 0 | 24 | 40 | 56 | 100 |
Normalized Score Distribution
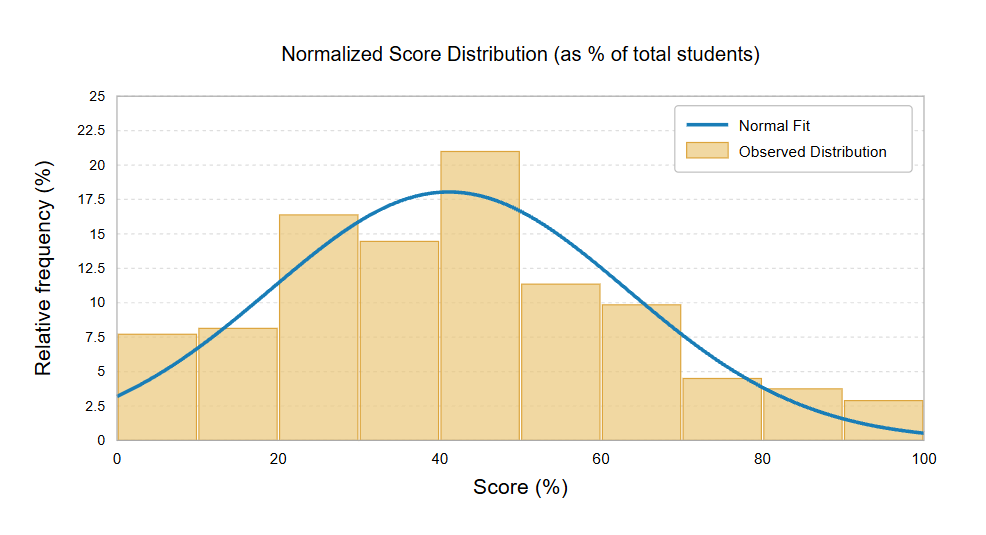
Bars show the proportion of students per score range; curve shows normal fit.
Grade 6 Top Math Stars
| Student | School | City | Province/State | Country |
|---|---|---|---|---|
| Luca Y. | Collingwood School | West Vancouver | British Columbia | Canada |
| Lynette L. | The Bishop Strachan School | Toronto | Ontario | Canada |
| Shanaya S. | Math Competition Coaching | Ashburn | Virginia | United States |
| Vivian N. | Collingwood School | West Vancouver | British Columbia | Canada |
| Lana C. | Pineland Public School | Burlington | Ontario | Canada |
| Reet W. | Fred C. Cook | Bradford | Ontario | Canada |
| Emily Y. | The Bishop Strachan School | Toronto | Ontario | Canada |
| Thomas J. | Math Competition Coaching | Ashburn | Virginia | United States |
| Rich L. | St. John Vianney Catholic Elementary School | Windsor | Ontario | Canada |
| Tiffany Z. | Collingwood School | West Vancouver | British Columbia | Canada |
| Grace W. | Pineland Public School | Burlington | Ontario | Canada |
| Arjun M. | Fred C. Cook | Bradford | Ontario | Canada |
| Mingxi S. | Orchard Park Public School | London | Ontario | Canada |
| Penny R. | The Bishop Strachan School | Toronto | Ontario | Canada |