Grade 3 National Score Analysis
Key percentile cutoffs and distribution overview for the January 2026 ICMC results.
Top 1%
≥ 90
Top 5%
≥ 77
Top 10%
≥ 69
Top 25%
≥ 54
Five-Number Summary
| Minimum | Q1 (25%) | Median | Q3 (75%) | Maximum |
|---|---|---|---|---|
| 0 | 23 | 33 | 54 | 100 |
Normalized Score Distribution
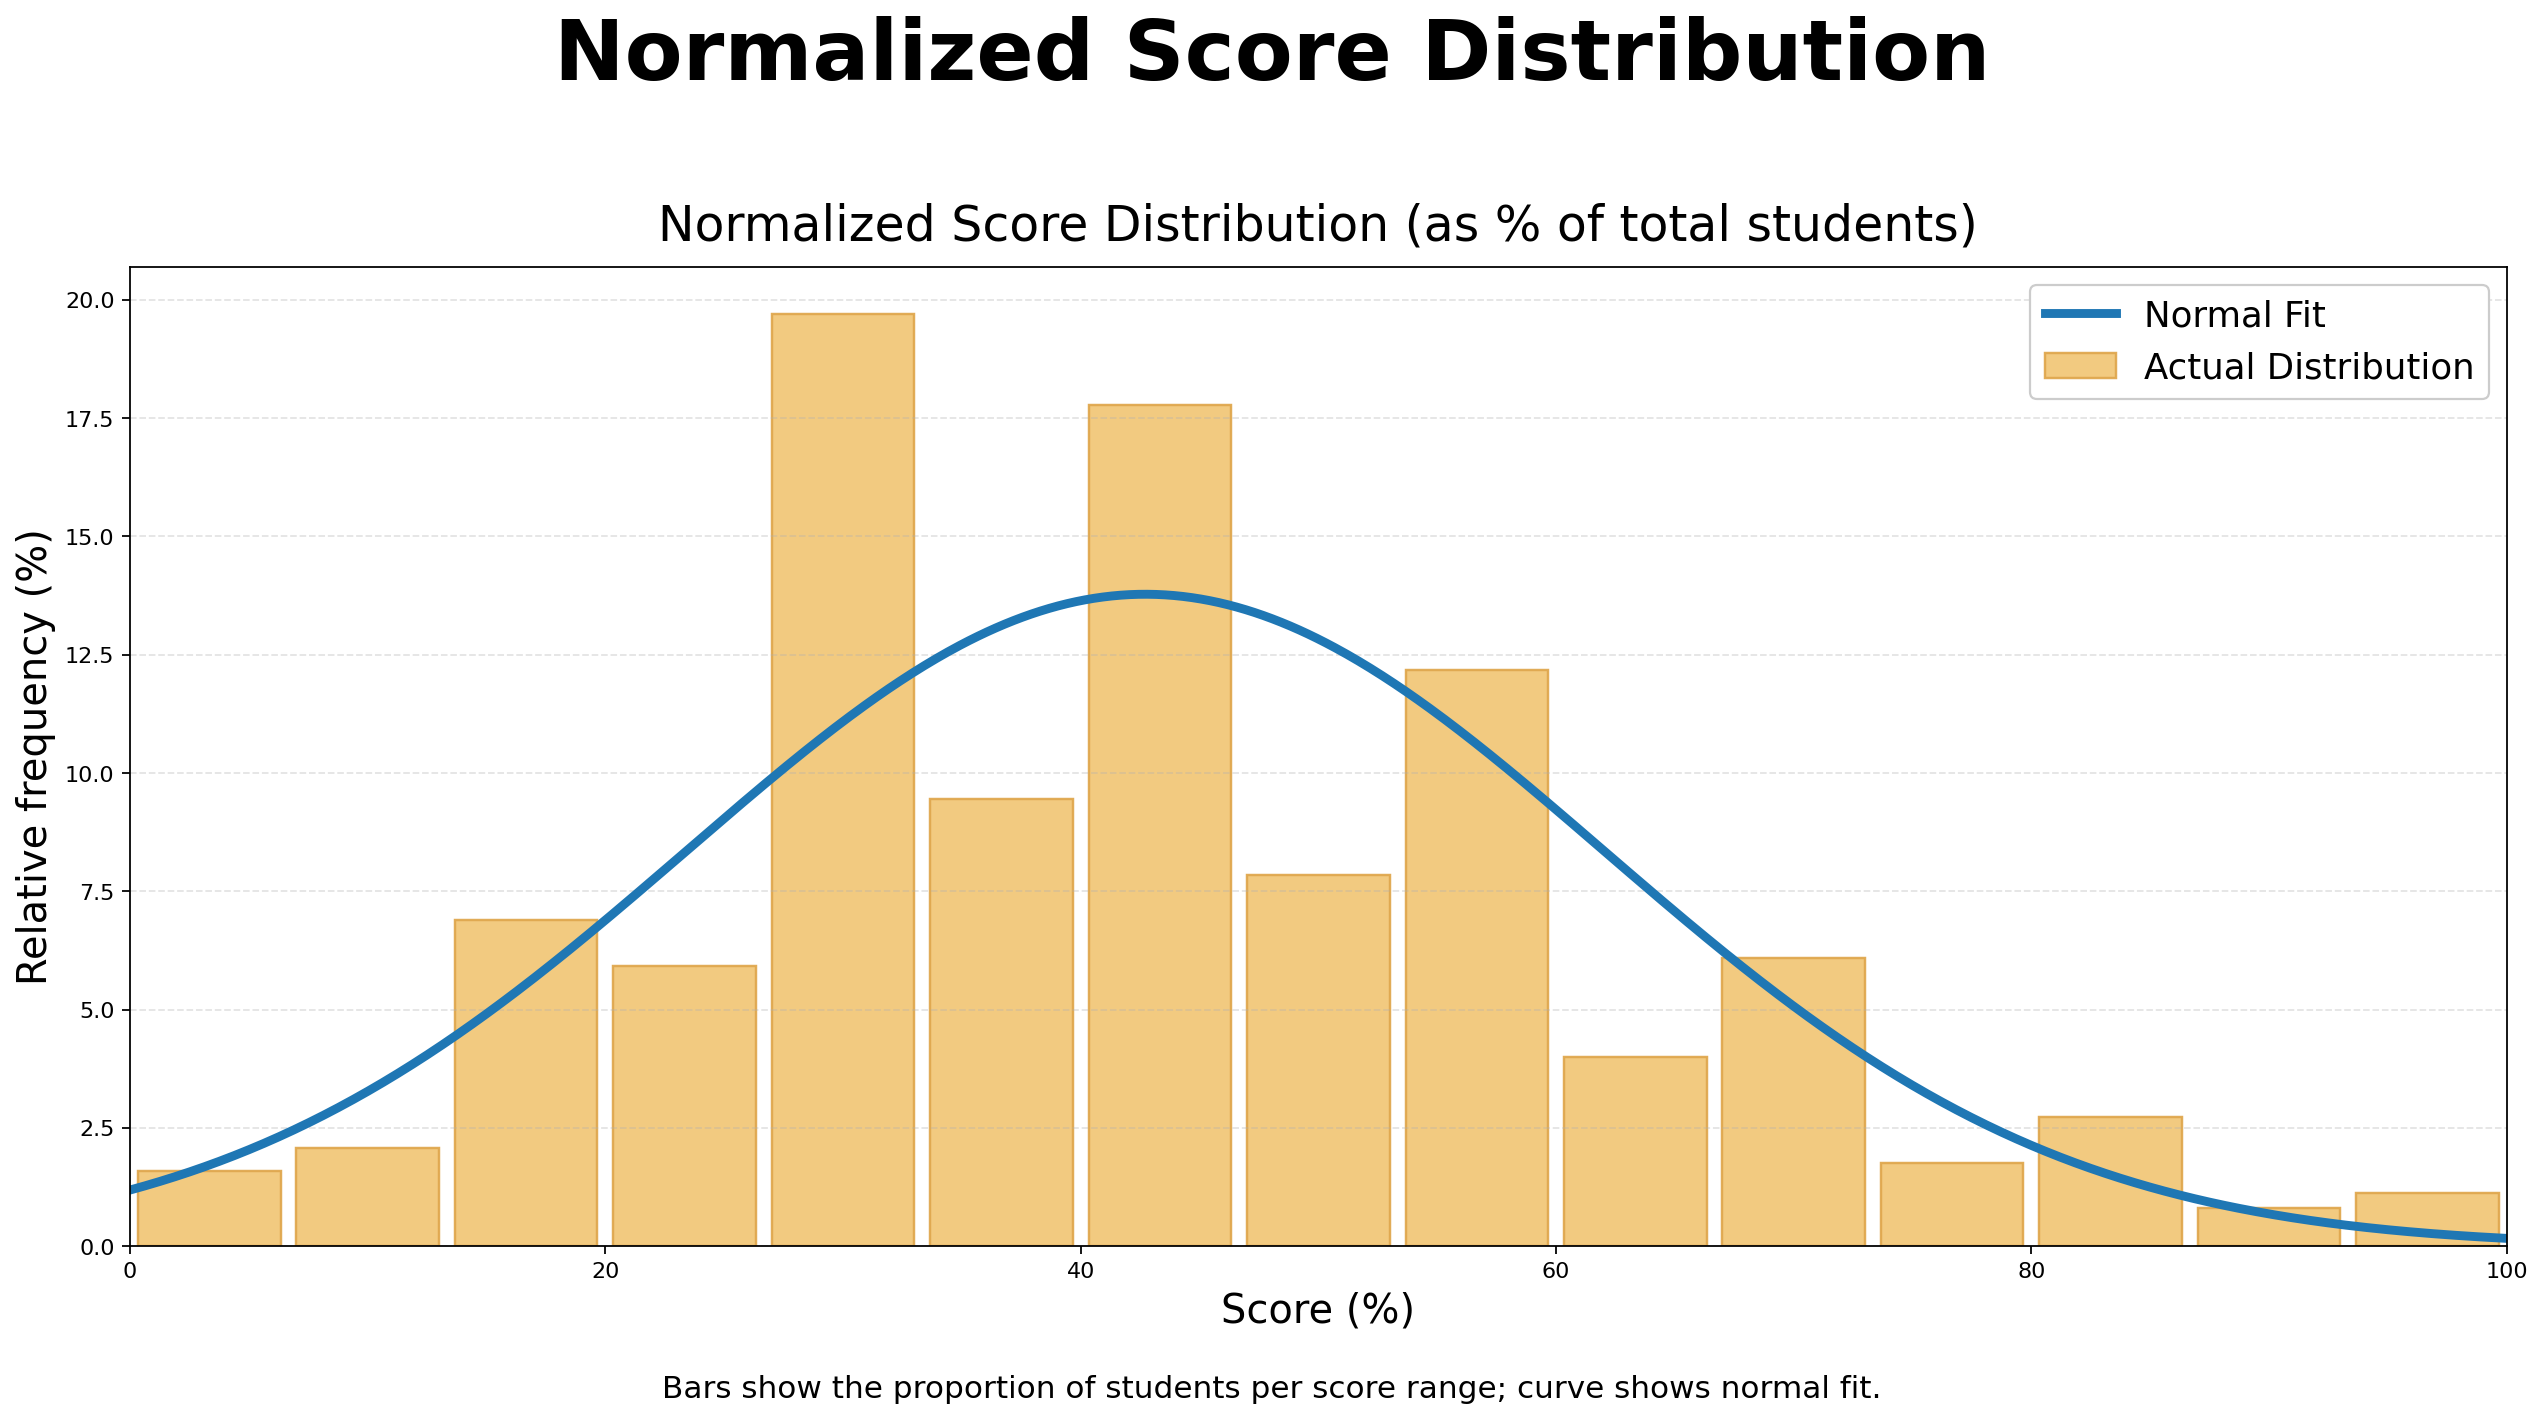
Bars show the proportion of students per score range; curve shows normal fit.
Grade 3 Top 10 Math Stars
| Rank | Student | School | City | Province/State | Country |
|---|---|---|---|---|---|
| 1 | Brian Y. | Holy Cross Catholic Elementary School | Lasalle | Ontario | Canada |
| 2 | Vanya G. | Math Competition Coaching | Ashburn | Virginia | USA |
| 3 | William L. | Queen Of All Saints Elementary School | Coquitlam | British Columbia | Canada |
| 4 | Jeffrey L. | Collingwood School | West Vancouver | British Columbia | Canada |
| 5 | Noah C. | Safa And Marwa | Mississauga | Ontario | Canada |
| 6 | Lewis C. | Aurora Prep Academy | Aurora | Ontario | Canada |
| 7 | Jibrael F. | Safa And Marwa | Mississauga | Ontario | Canada |
| 8 | Rithvik K. | Willowbrook Elementary School | Bentonville | Arkansas | USA |
| 9 | Zaheer O. | Safa And Marwa | Mississauga | Ontario | Canada |
| 10 | Vera D. | Aurora Prep Academy | Aurora | Ontario | Canada |