Grade 2 National Score Analysis
Key percentile cutoffs and distribution overview for the January 2026 ICMC results.
Top 1%
≥ 83
Top 5%
≥ 66
Top 10%
≥ 60
Top 25%
≥ 44
Five-Number Summary
| Minimum | Q1 (25%) | Median | Q3 (75%) | Maximum |
|---|---|---|---|---|
| 0 | 23 | 33 | 44 | 94 |
Normalized Score Distribution
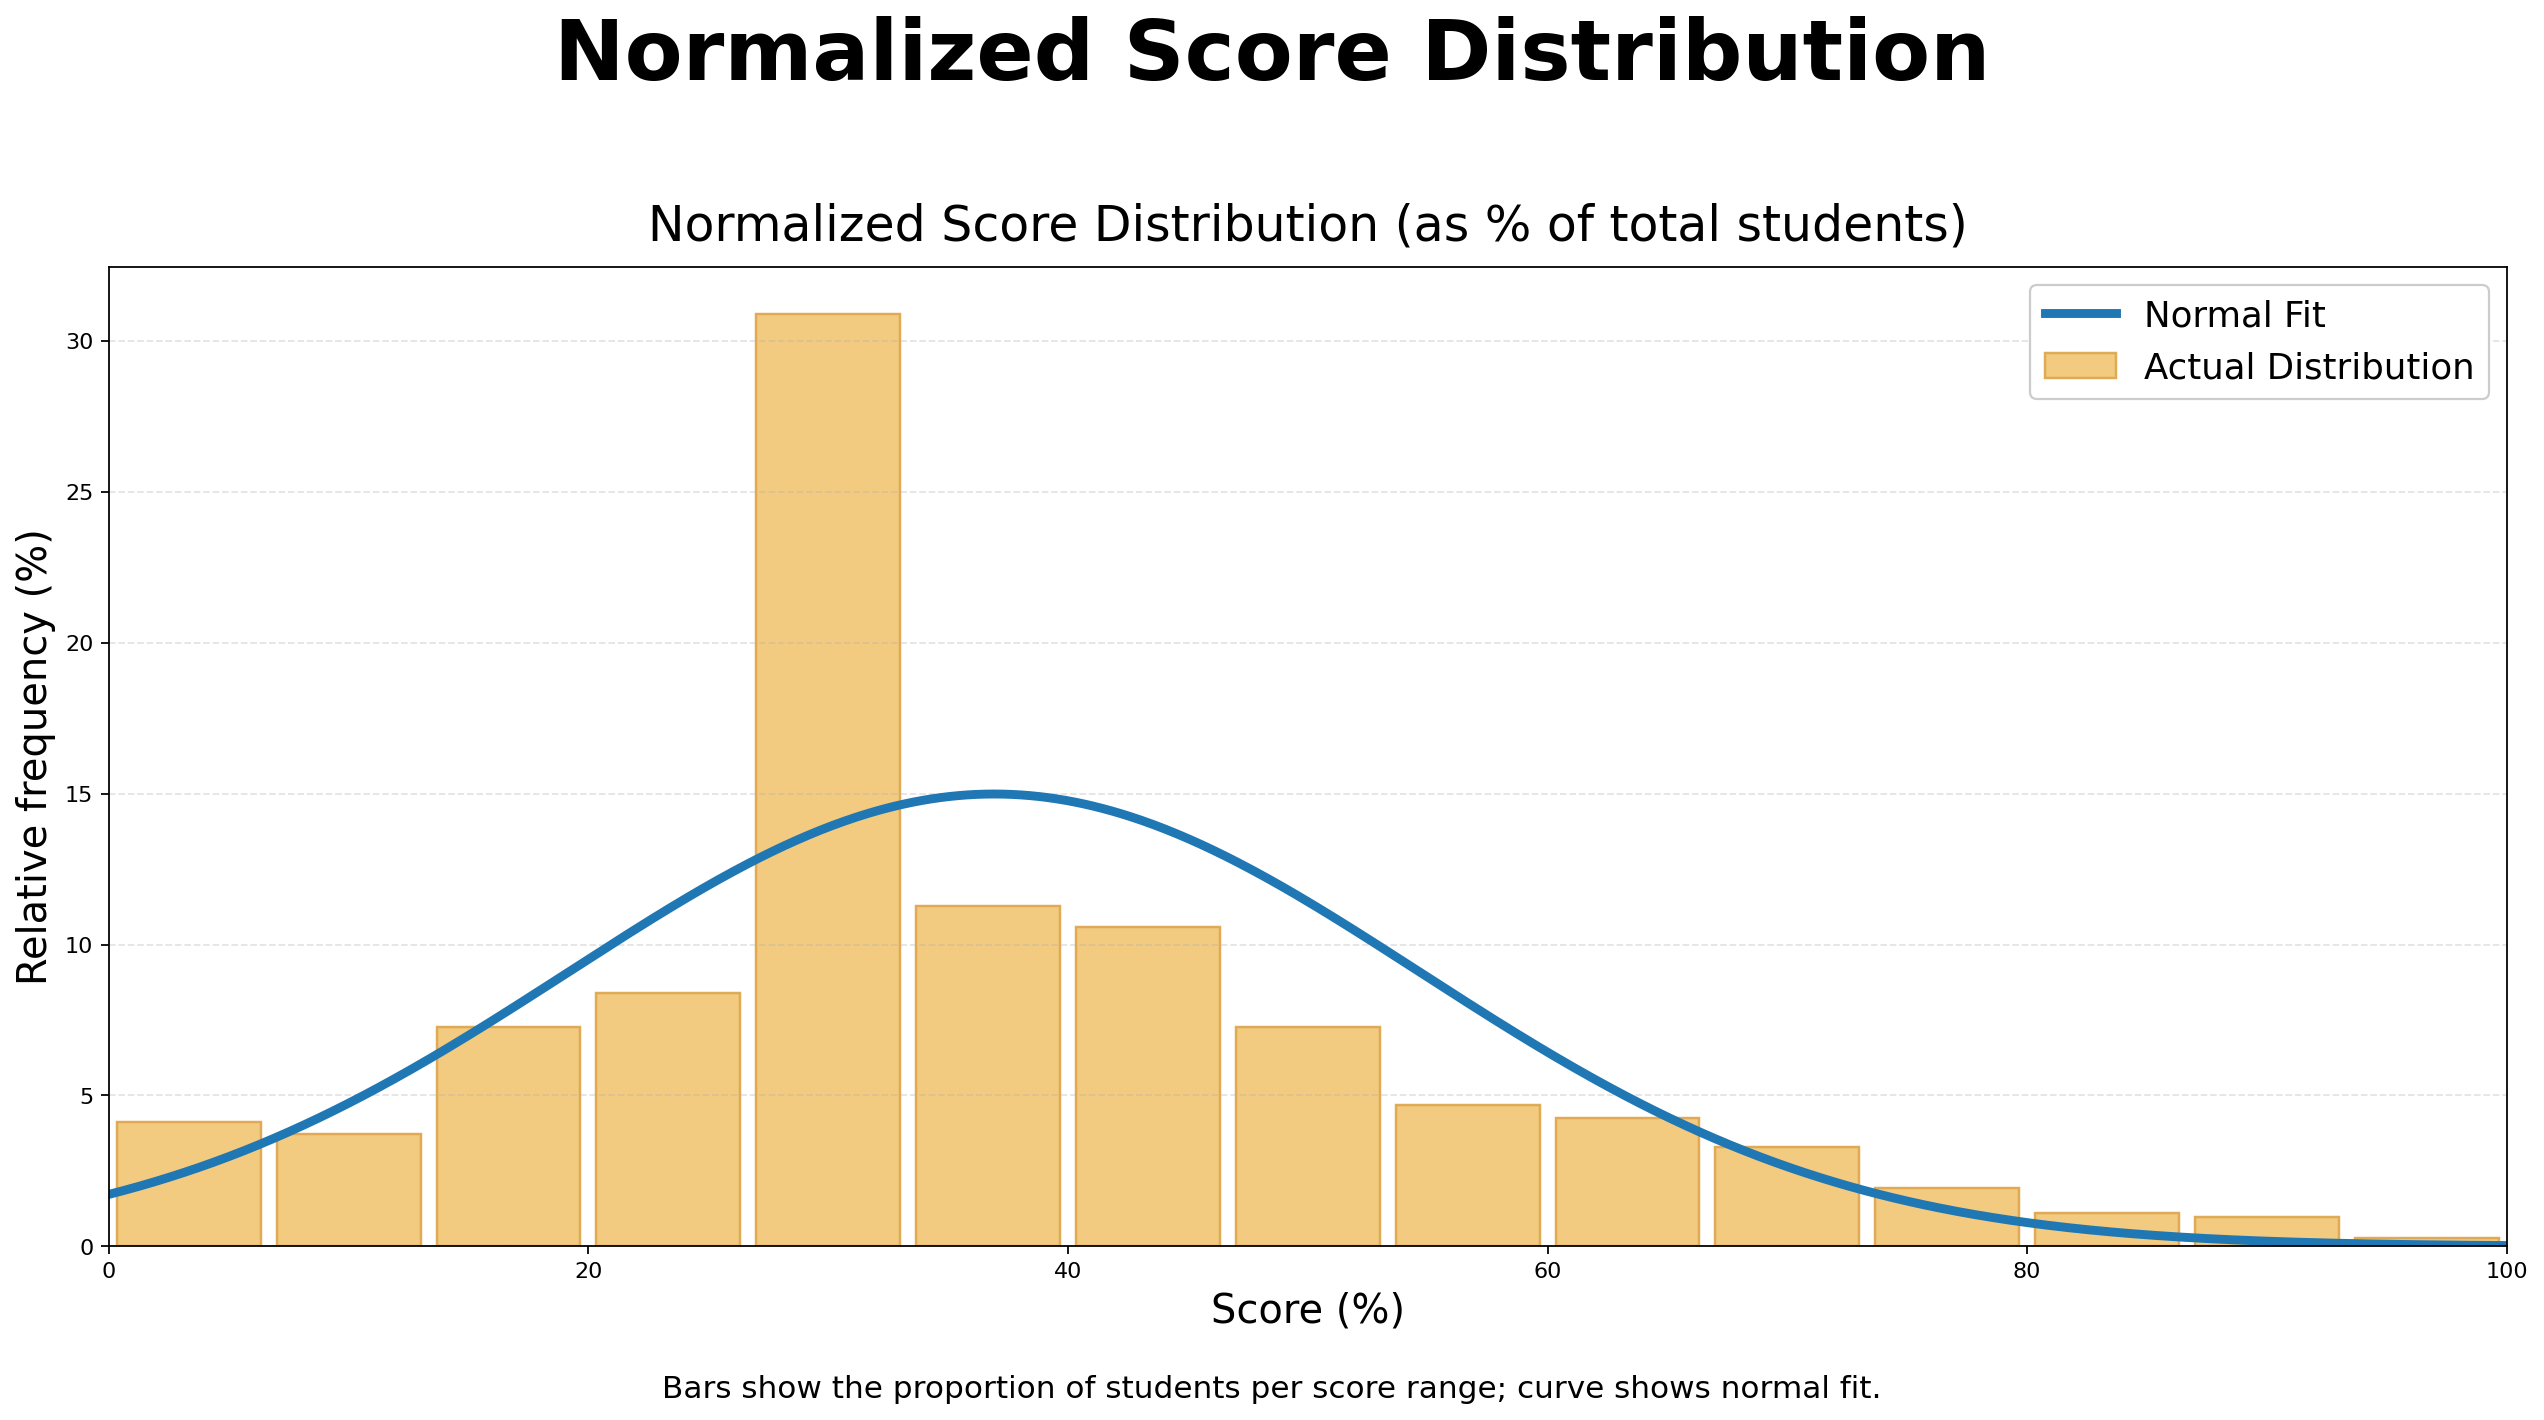
Bars show the proportion of students per score range; curve shows normal fit.
Grade 2 Top 10 Math Stars
| Rank | Student | School | City | Province/State | Country |
|---|---|---|---|---|---|
| 1 | Selina L. | Stittsville Public School | Ottawa | Ontario | Canada |
| 2 | Raymond W. | Mount Pleasant school | Edmonton | Alberta | Canada |
| 3 | Annabella P. | New Horizons School | Sherwood Park | Alberta | Canada |
| 4 | Yumi S. | New Horizons School | Sherwood Park | Alberta | Canada |
| 5 | Logan K. | New Horizons School | Sherwood Park | Alberta | Canada |
| 6 | Liam H. | Marigold Elementary | Victoria | British Columbia | Canada |
| 7 | Rory N. | New Horizons School | Sherwood Park | Alberta | Canada |
| 8 | Matti E. | Queen Of All Saints Elementary School | Coquitlam | British Columbia | Canada |
| 9 | Nawab S. | Southwood Public School | Windsor | Ontario | Canada |
| 10 | Prabhav B. | Math Competition Coaching | Ashburn | Virginia | USA |