Grade 1 National Score Analysis
Key percentile cutoffs and distribution overview for the February 2026 ICMC results.
Top 1%
≥ 78
Top 5%
≥ 61
Top 10%
≥ 55
Top 25%
≥ 41
Five-Number Summary
| Minimum | Q1 (25%) | Median | Q3 (75%) | Maximum |
|---|---|---|---|---|
| 0 | 22 | 31 | 41 | 100 |
Normalized Score Distribution
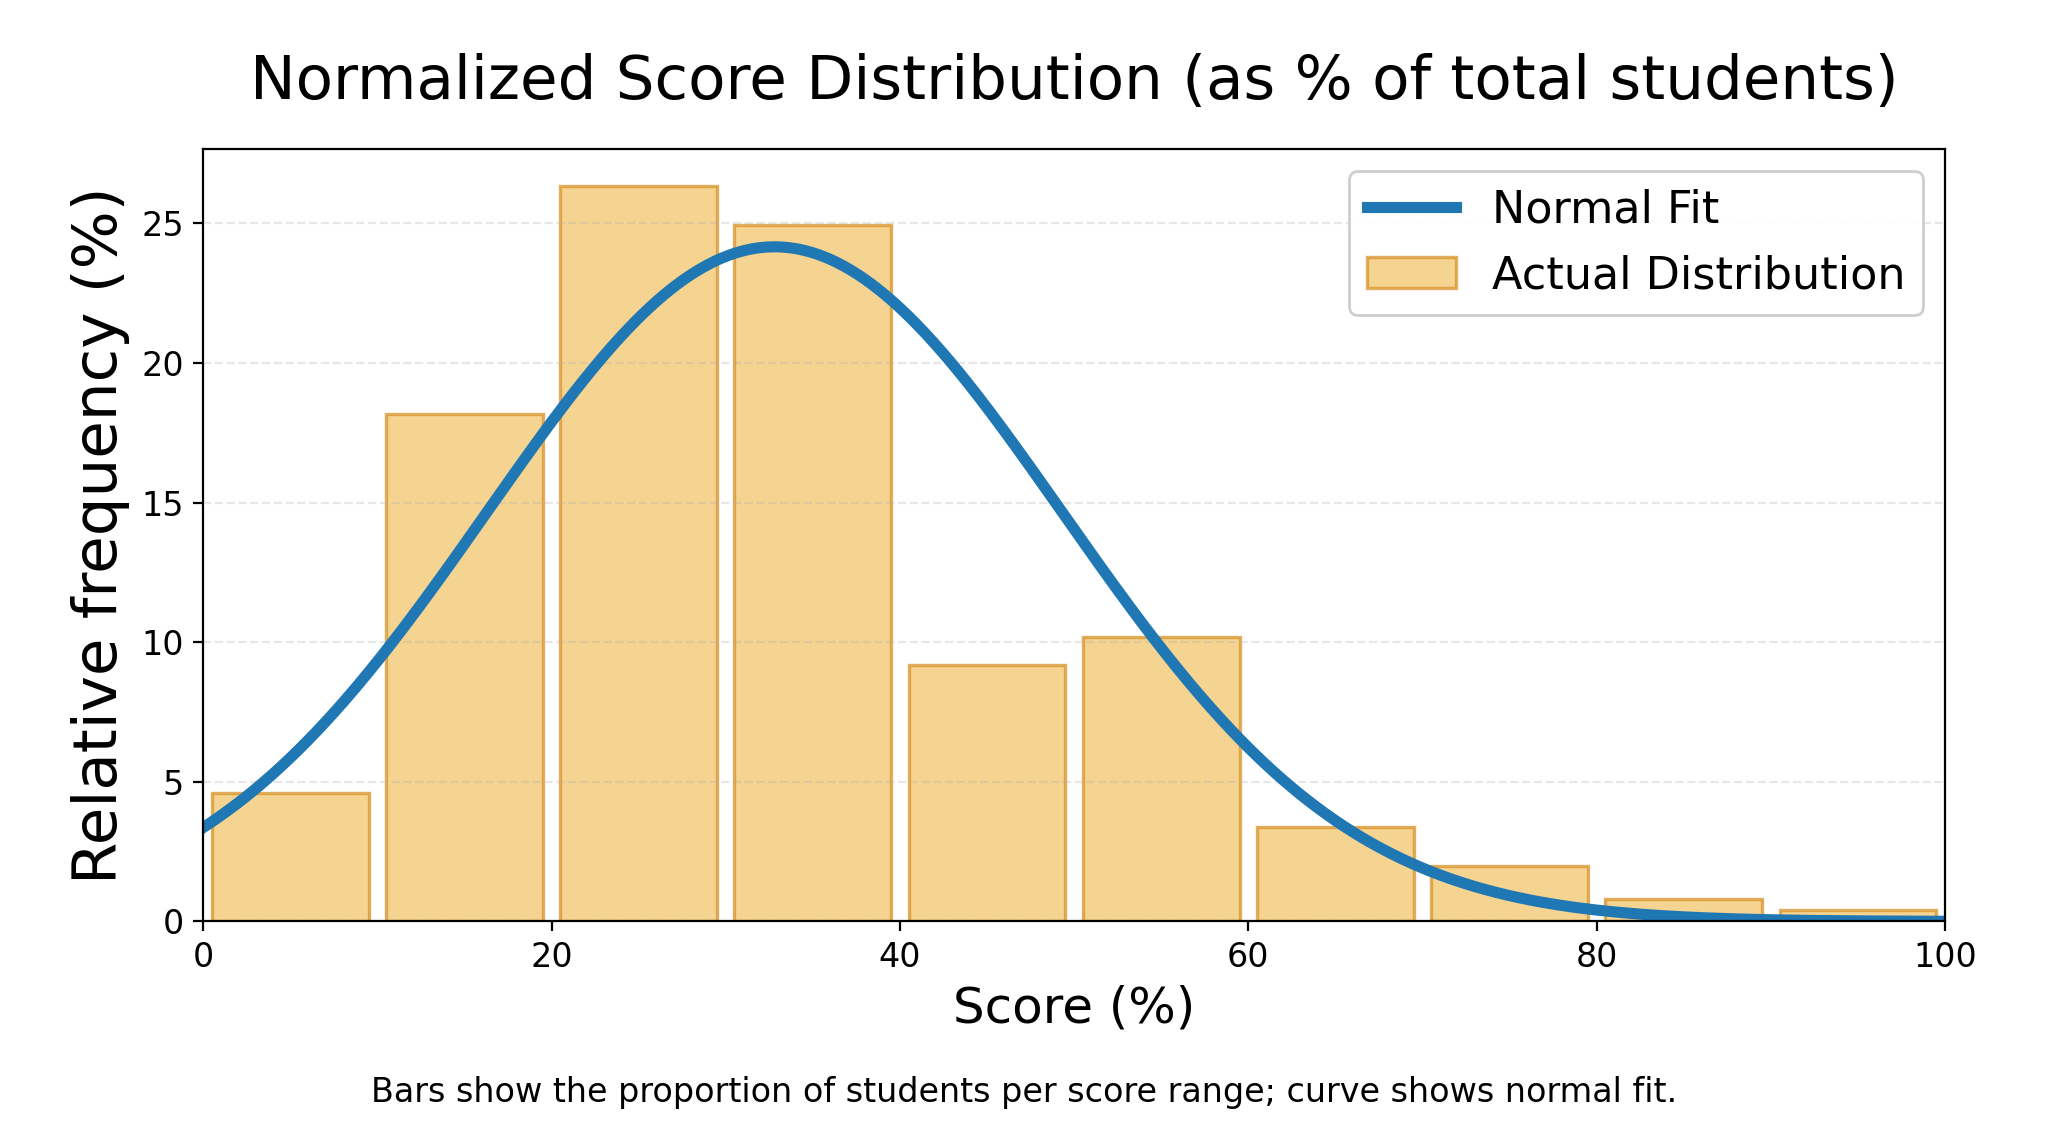
Bars show the proportion of students per score range; curve shows normal fit.
Grade 1 Top Math Stars
| Rank | Student | School | City | Province/State | Country |
|---|---|---|---|---|---|
| 1 | Grace W. | Pineland Public School | Burlington | Ontario | Canada |
| 2 | Bohan S. | St. Joseph Catholic Elementary School | Lasalle | Ontario | Canada |
| 3 | Zachary L. | Aurora Prep Academy | Aurora | Ontario | Canada |
| 4 | Nicky H. | Marigold Elementary | Victoria | British Columbia | Canada |
| 5 | Andre Y. | Holy Cross Catholic Elementary School | Lasalle | Ontario | Canada |
| 6 | Grace W. | Halton Hills Christian School | Georgetown | Ontario | Canada |
| 7 | Lavinia C. | Aurora Prep Academy | Aurora | Ontario | Canada |
| 8 | Rocco C. | Queen Of All Saints Elementary School | Coquitlam | British Columbia | Canada |
| 9 | Marro S. | Mulgrave School | West Vancouver | British Columbia | Canada |
| 10 | James L. | Kennedy Public School | Scarborough | Ontario | Canada |