Grade 8 National Score Analysis
Key percentile cutoffs and distribution overview for the April 2026 ICMC results.
Top 1%
≥ 84
Top 5%
≥ 70
Top 10%
≥ 64
Top 25%
≥ 48
Five-Number Summary
| Minimum | Q1 (25%) | Median | Q3 (75%) | Maximum |
|---|---|---|---|---|
| 0 | 16 | 30 | 48 | 96 |
Normalized Score Distribution
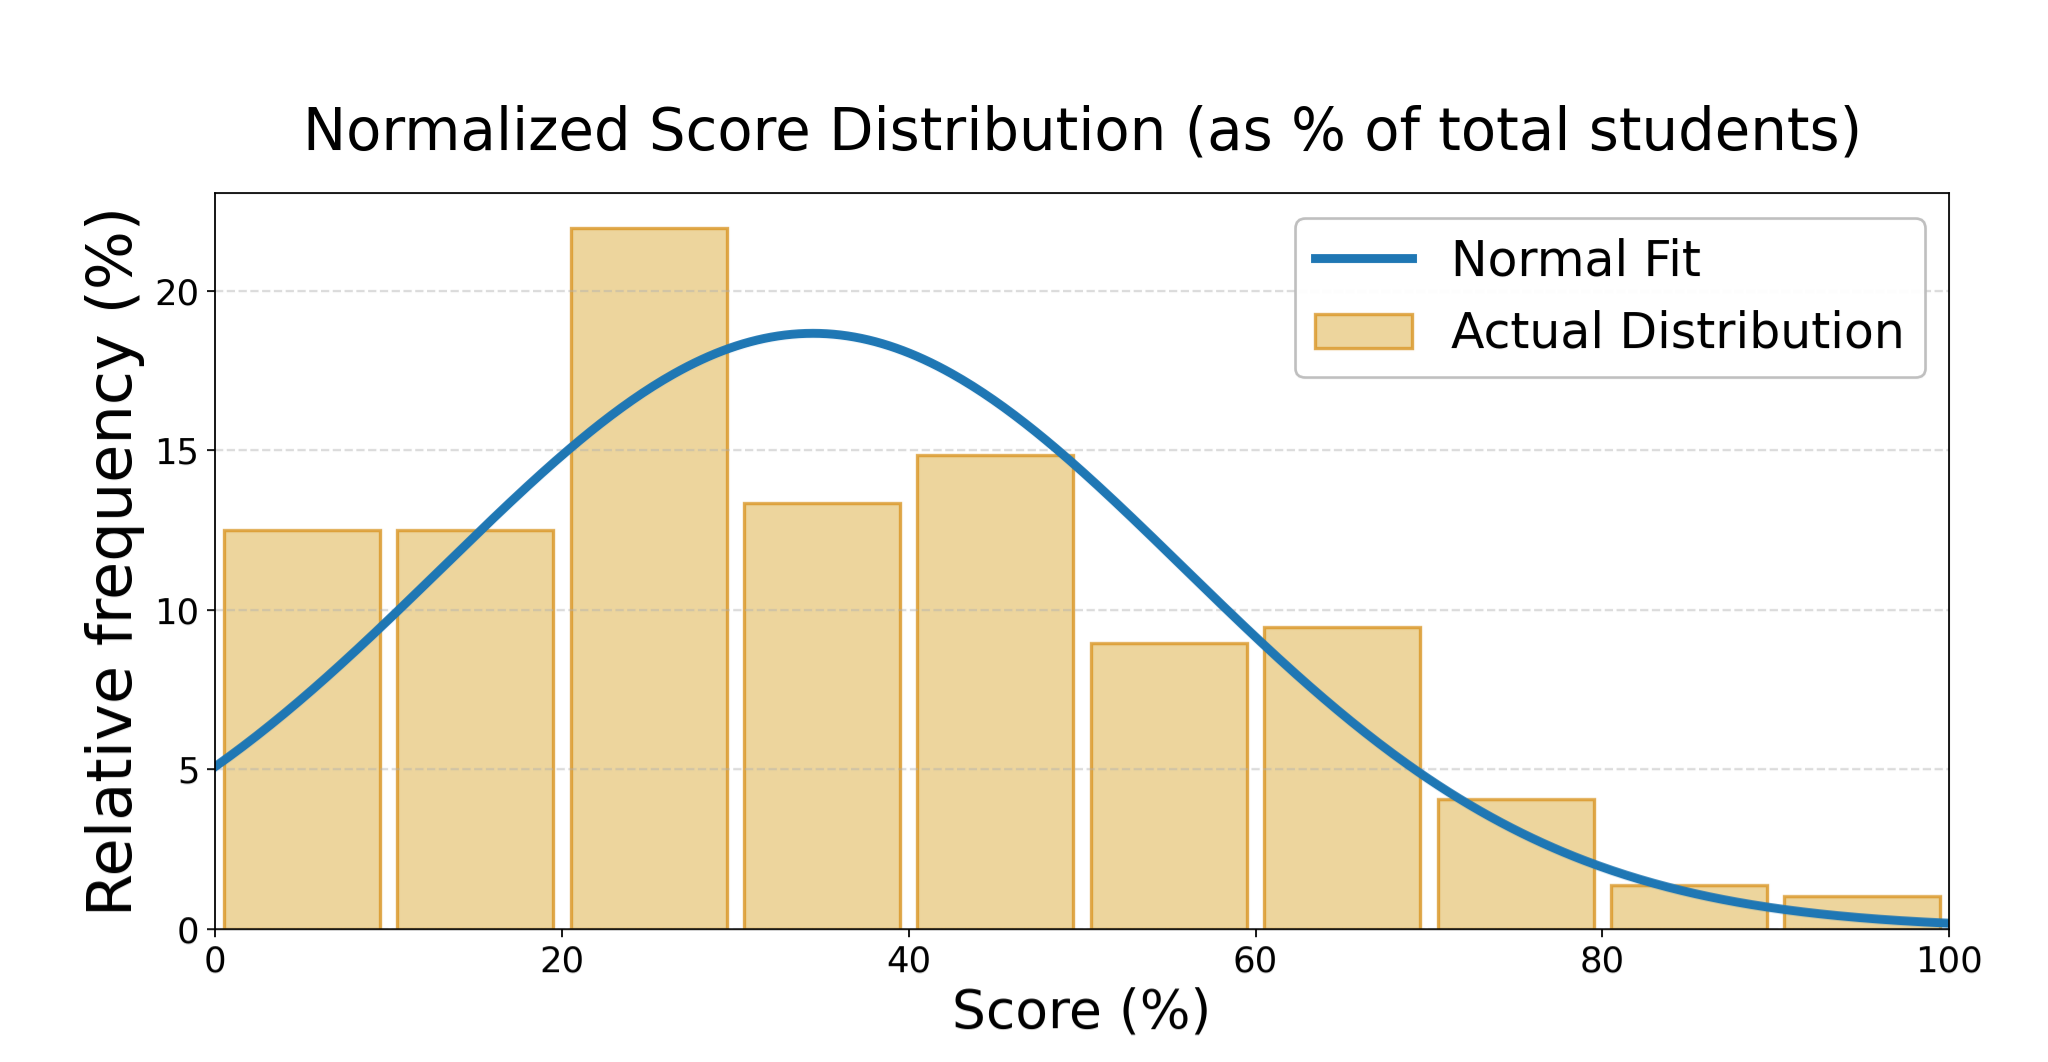
Bars show the proportion of students per score range; curve shows normal fit.
Grade 8 Top Math Stars
| Rank | Student | School | City | Province/State | Country |
|---|---|---|---|---|---|
| 1 | Aadhya D. | Math Competition Coaching | Ashburn | Virginia | USA |
| 2 | Marissa G. | Sandwich West Public School | Lasalle | Ontario | Canada |
| 3 | Vivaan S. | Math Competition Coaching | Ashburn | Virginia | USA |
| 4 | Yurii K. | George Street Middle School | Fredericton | New Brunswick | Canada |
| 5 | William F. | St. Marguerite D'Youville | Oakville | Ontario | Canada |
| 6 | Aaron P. | White Rock Christian Academy | Surrey | British Columbia | Canada |
| 7 | Rhea S. | Math Competition Coaching | Ashburn | Virginia | USA |
| 8 | Vagmi S. | George Street Middle School | Fredericton | New Brunswick | Canada |
| 9 | Vedant P. | George Street Middle School | Fredericton | New Brunswick | Canada |
| 10 | Alex W. | Maple Leaf Public School | North York | Ontario | Canada |