Grade 7 National Score Analysis
Key percentile cutoffs and distribution overview for the November 2025 ICMC results.
Top 1%
≥ 72
Top 5%
≥ 56
Top 10%
≥ 52
Top 25%
≥ 44
Five-Number Summary
| Minimum | Q1 (25%) | Median | Q3 (75%) | Maximum |
|---|---|---|---|---|
| 0 | 24 | 36 | 44 | 88 |
Normalized Score Distribution
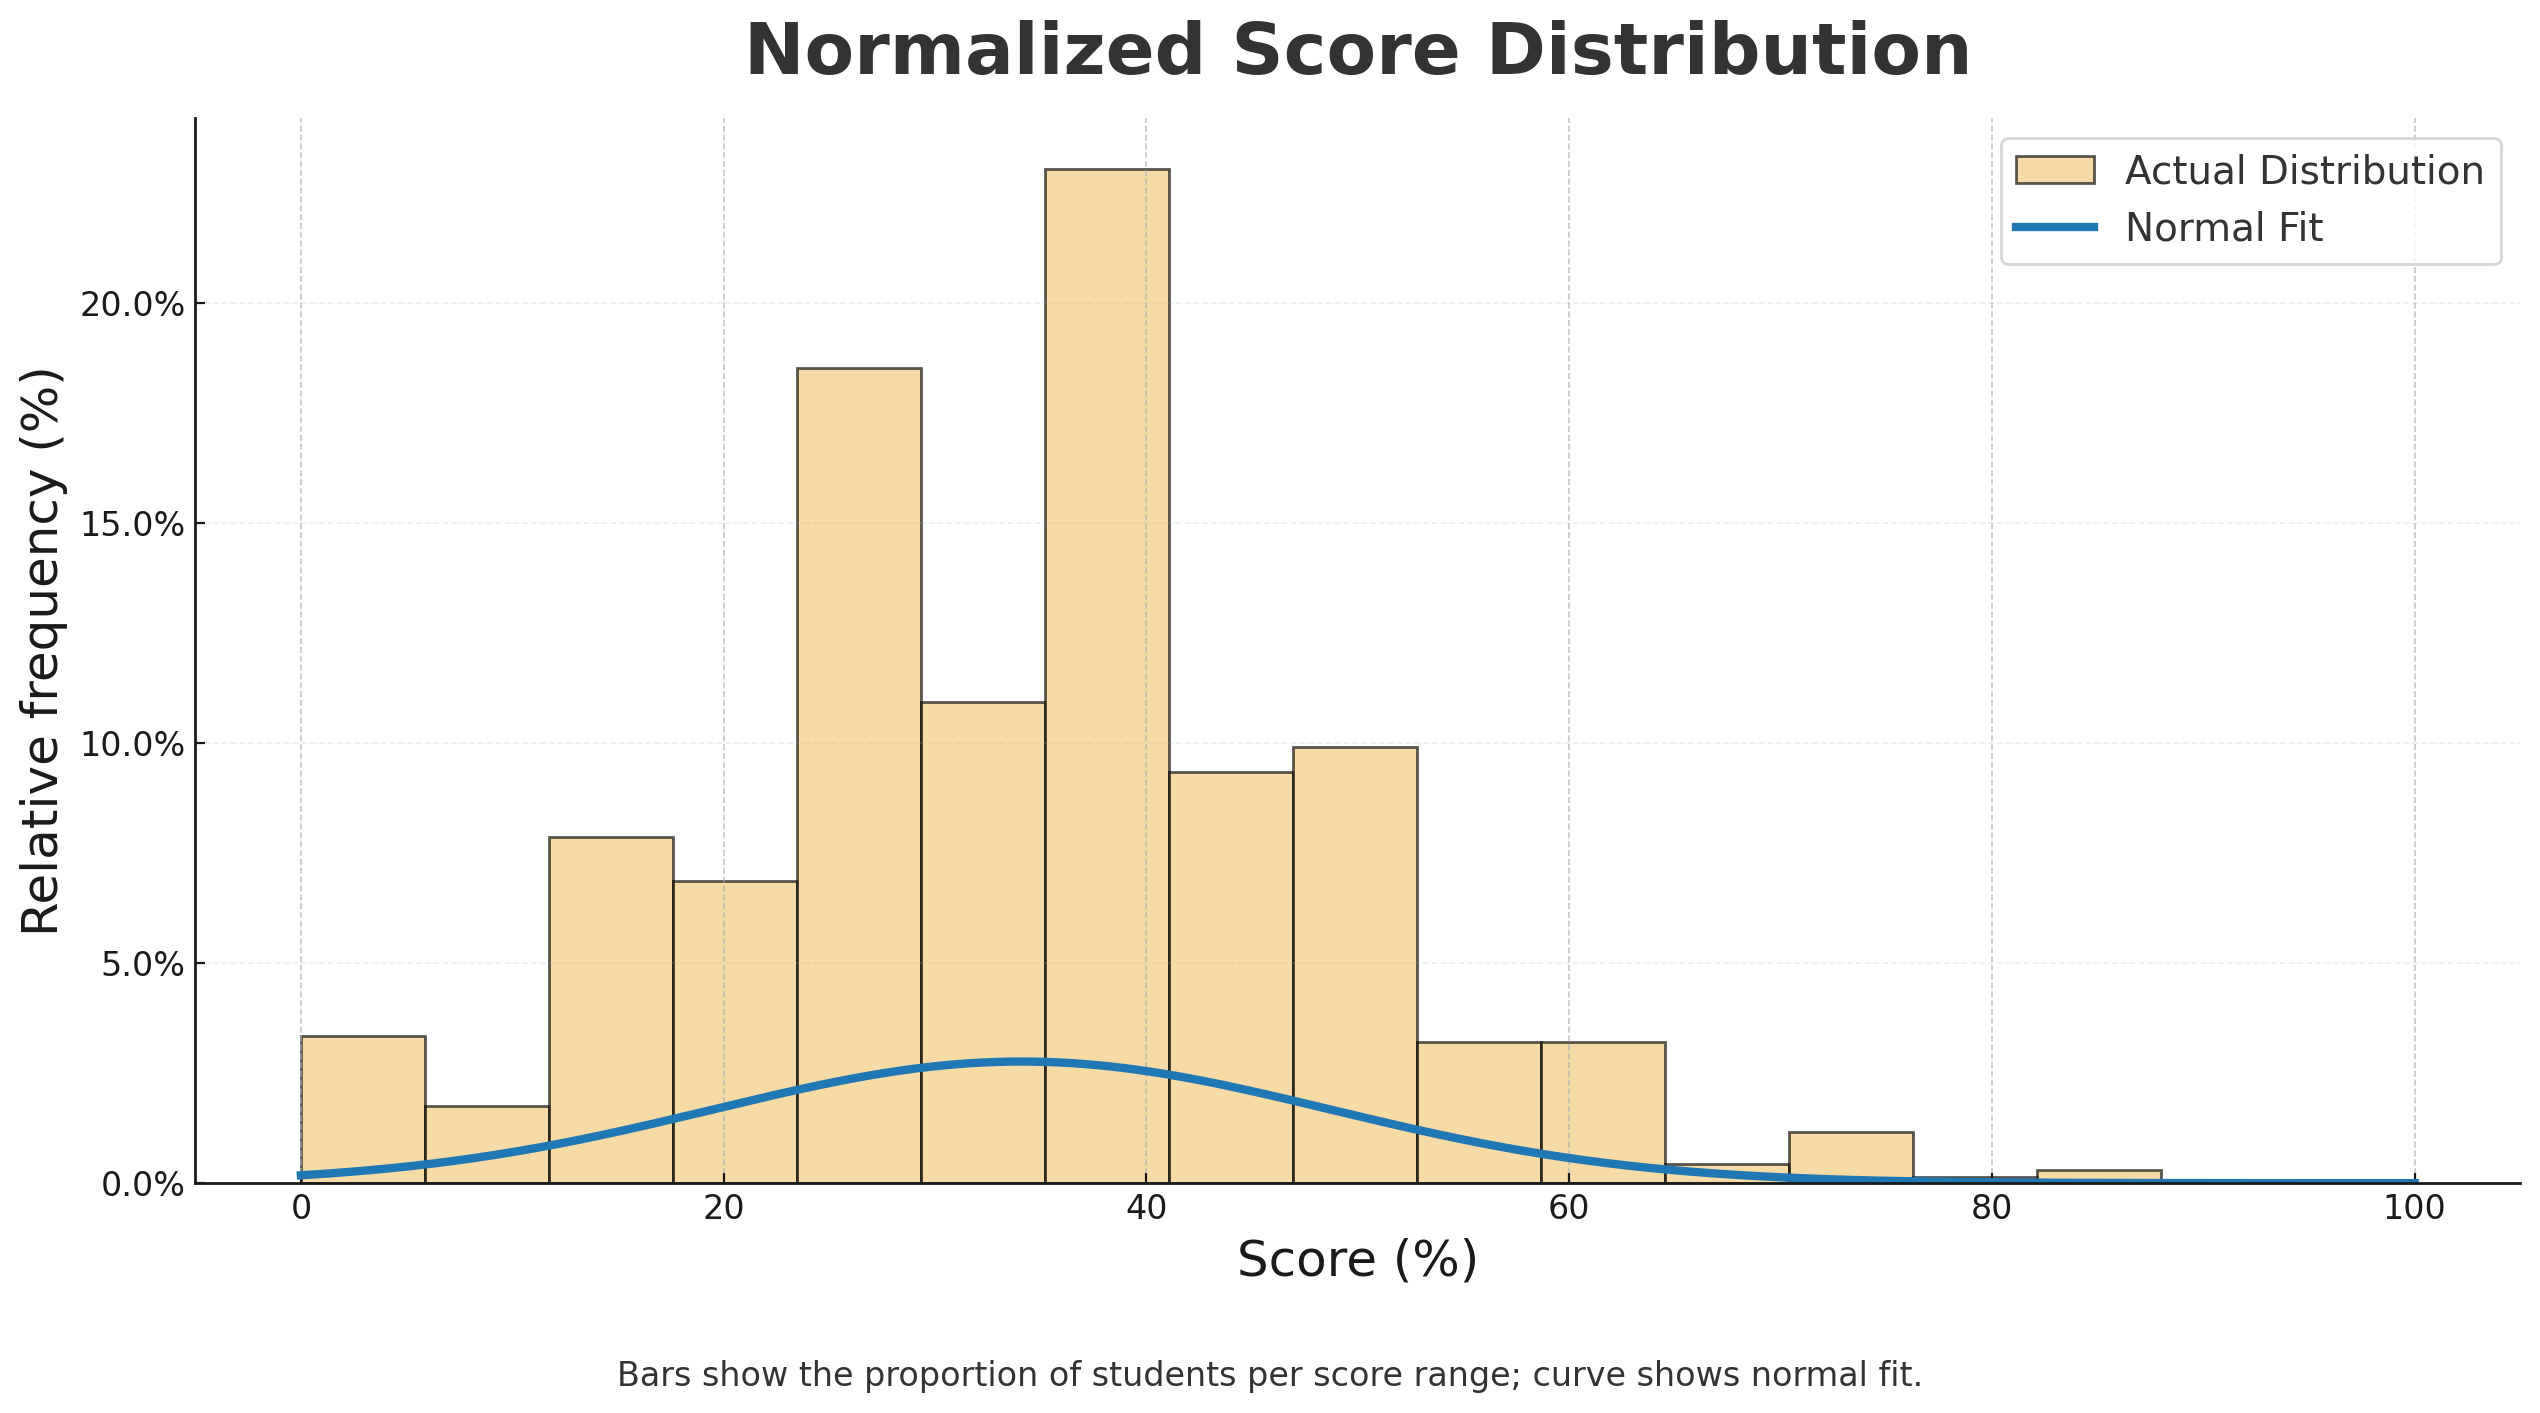
Bars show the proportion of students per score range; curve shows normal fit.
Grade 7 Top 10 Math Stars
| Rank | Student | School | City | Province/State | Country |
|---|---|---|---|---|---|
| 1 | John B. | Collingwood School | West Vancouver | British Columbia | Canada |
| 2 | Sophie L. | Collingwood School | West Vancouver | British Columbia | Canada |
| 3 | Ean D. | Collingwood School | West Vancouver | British Columbia | Canada |
| 4 | Helen G. | Sandwich West Public School | Lasalle | Ontario | Canada |
| 5 | Divya K. | Math Competition Coaching | Ashburn | Virginia | USA |
| 6 | Vincenzo D. | Pineland P.S. | Burlington | Ontario | Canada |
| 7 | Lucas M. | East Alternative School of Toronto | Toronto | Ontario | Canada |
| 8 | Emily T. | Centennial Public School | Waterloo | Ontario | Canada |
| 9 | Aarav S. | Adrienne Clarkson Public School | Richmond Hill | Ontario | Canada |
| 10 | Maya R. | Nottawa Elementary School | Collingwood | Ontario | Canada |