Grade 7 National Score Analysis
Key percentile cutoffs and distribution overview for the January 2026 ICMC results.
Top 1%
≥ 80
Top 5%
≥ 67
Top 10%
≥ 59
Top 25%
≥ 49
Five-Number Summary
| Minimum | Q1 (25%) | Median | Q3 (75%) | Maximum |
|---|---|---|---|---|
| 0 | 27 | 34 | 49 | 96 |
Normalized Score Distribution
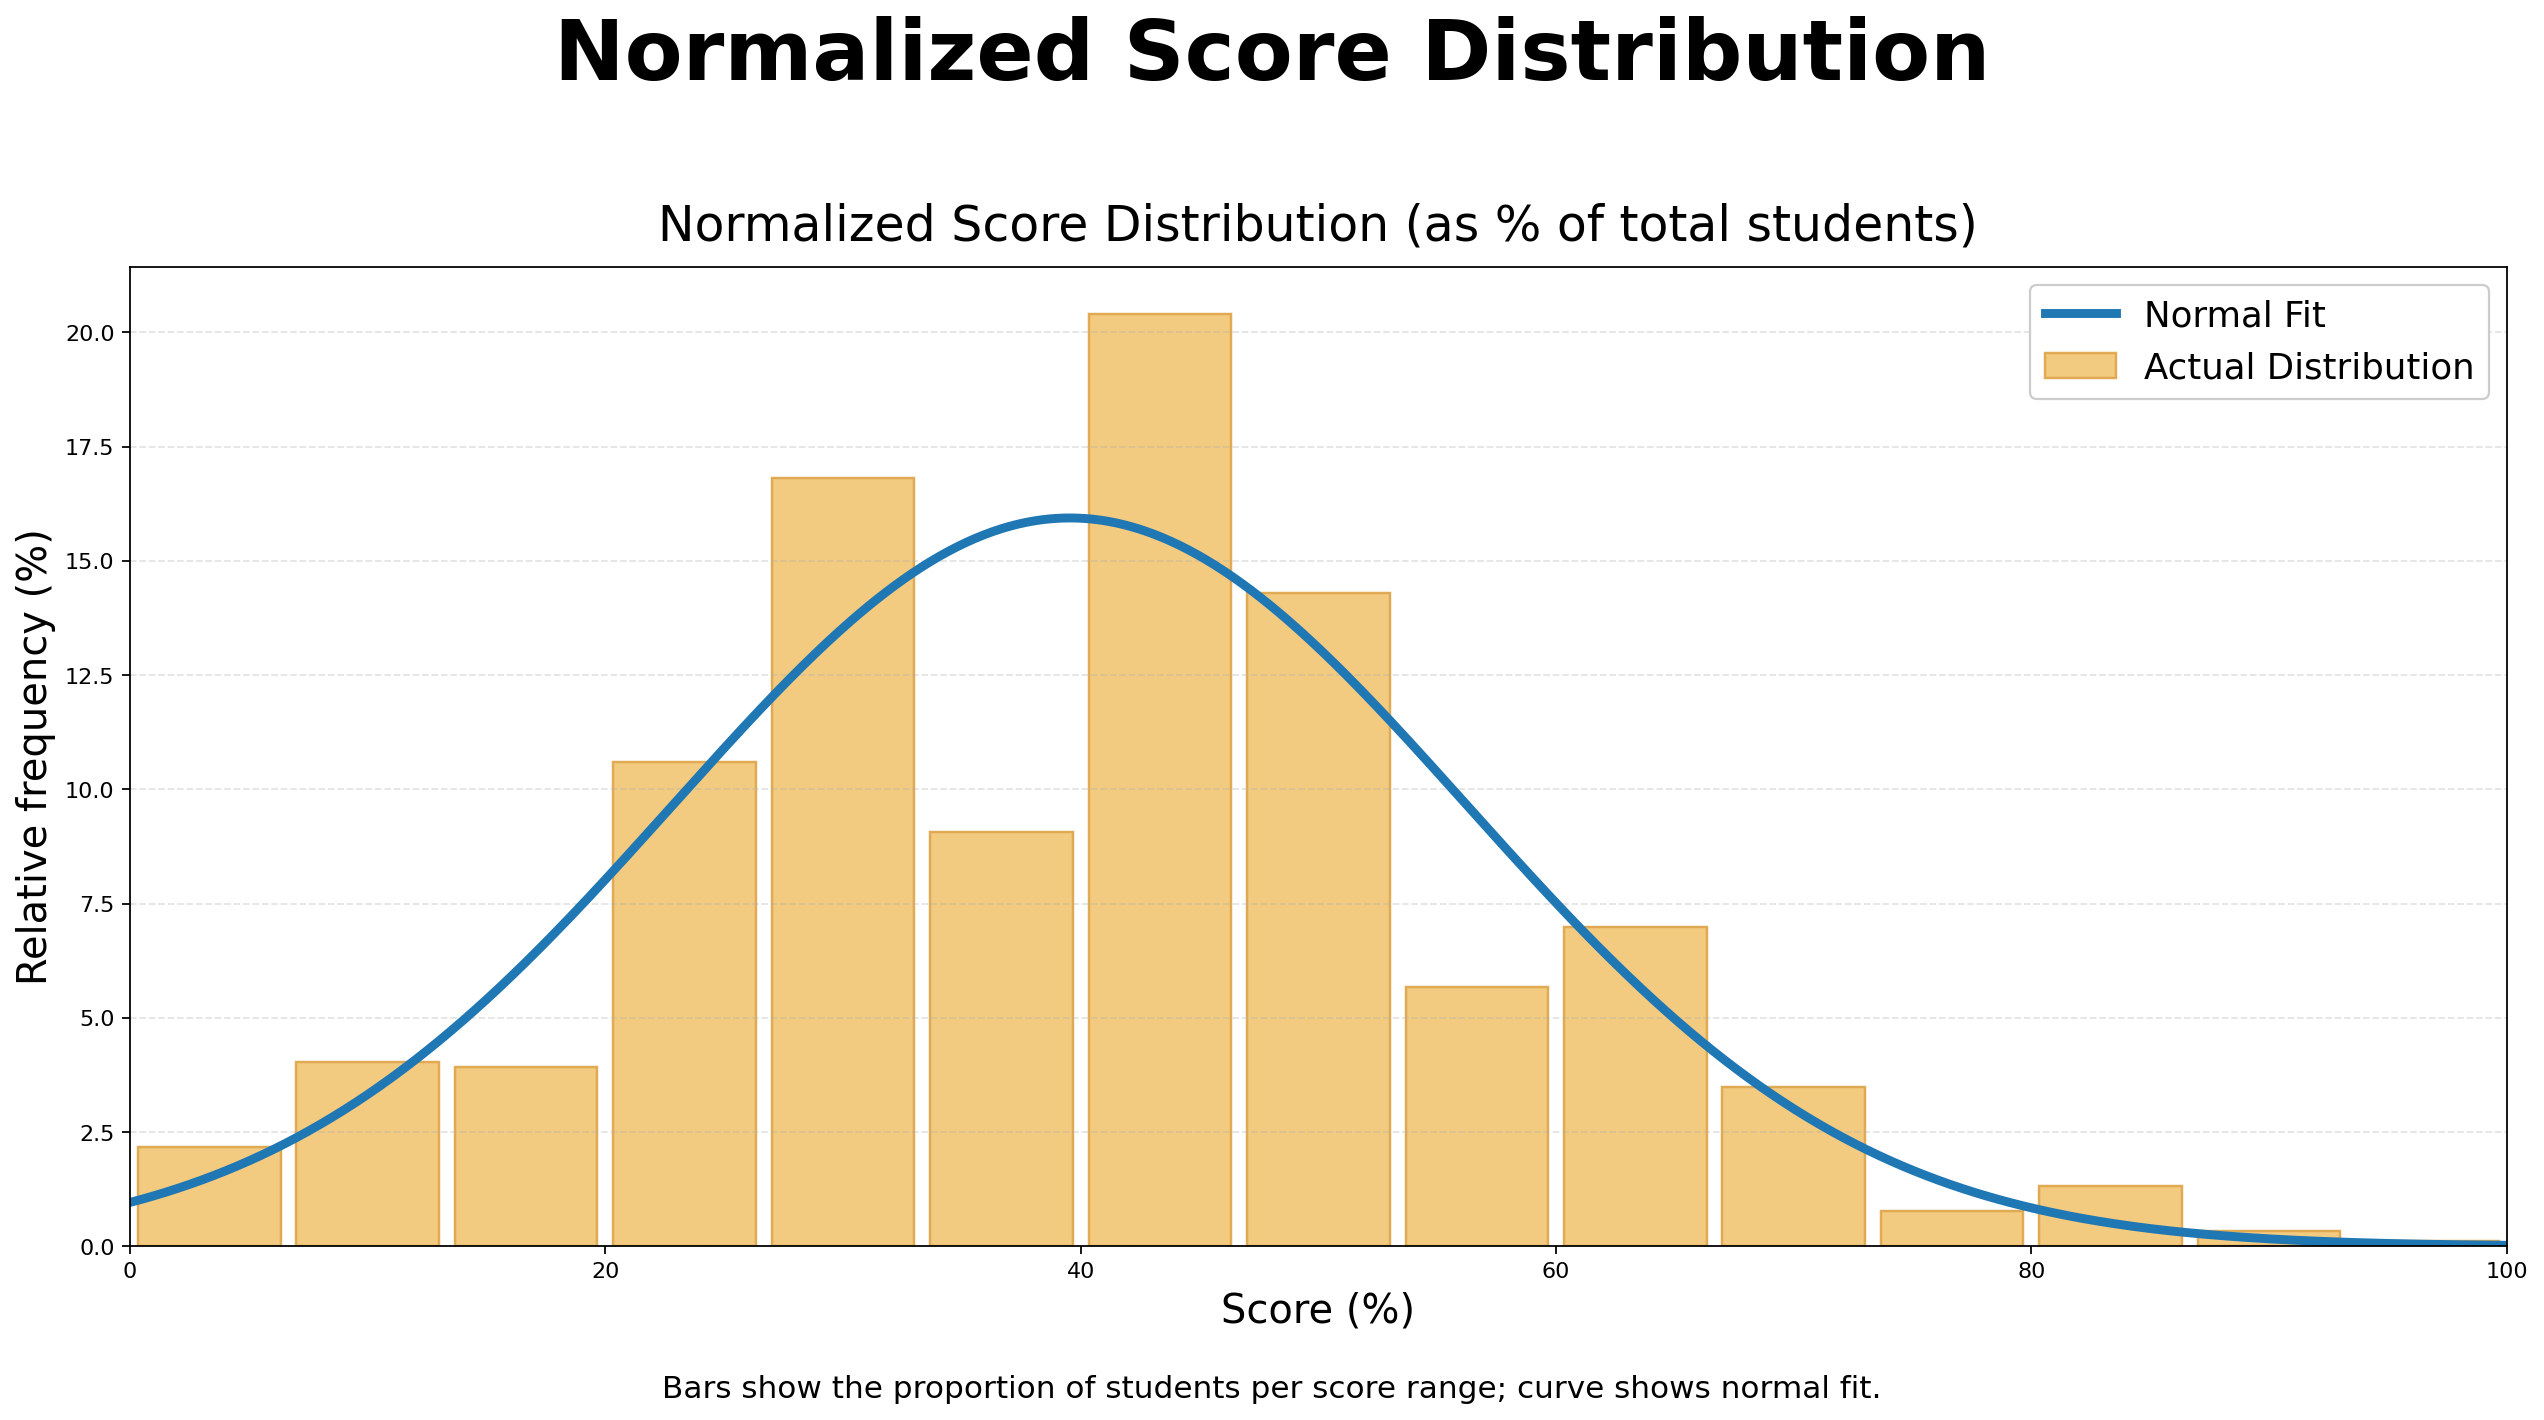
Bars show the proportion of students per score range; curve shows normal fit.
Grade 7 Top 10 Math Stars
| Rank | Student | School | City | Province/State | Country |
|---|---|---|---|---|---|
| 1 | Sophie L. | Collingwood School | West Vancouver | British Columbia | Canada |
| 2 | Dillon Z. | Collingwood School | West Vancouver | British Columbia | Canada |
| 3 | Sidharth U. | Math Competition Coaching | Ashburn | Virginia | USA |
| 4 | Ean Y. D. | Collingwood School | West Vancouver | British Columbia | Canada |
| 5 | Haoen G. | Sandwich West Public School | Lasalle | Ontario | Canada |
| 6 | Akshaj S. | Académie Ste-Cécile International School | Windsor | Ontario | Canada |
| 7 | Aarush K. | Math Competition Coaching | Ashburn | Virginia | USA |
| 8 | Emily | Halton Hills Christian School | Georgetown | Ontario | Canada |
| 9 | Albert A. | White Rock Christian Academy | Surrey | British Columbia | Canada |
| 10 | Samuel | Turnbull School | Ottawa | Ontario | Canada |