Grade 7 National Score Analysis
Key percentile cutoffs and distribution overview for the April 2026 ICMC results.
Top 1%
≥ 84
Top 5%
≥ 70
Top 10%
≥ 63
Top 25%
≥ 46
Five-Number Summary
| Minimum | Q1 (25%) | Median | Q3 (75%) | Maximum |
|---|---|---|---|---|
| 0 | 18 | 30 | 46 | 96 |
Normalized Score Distribution
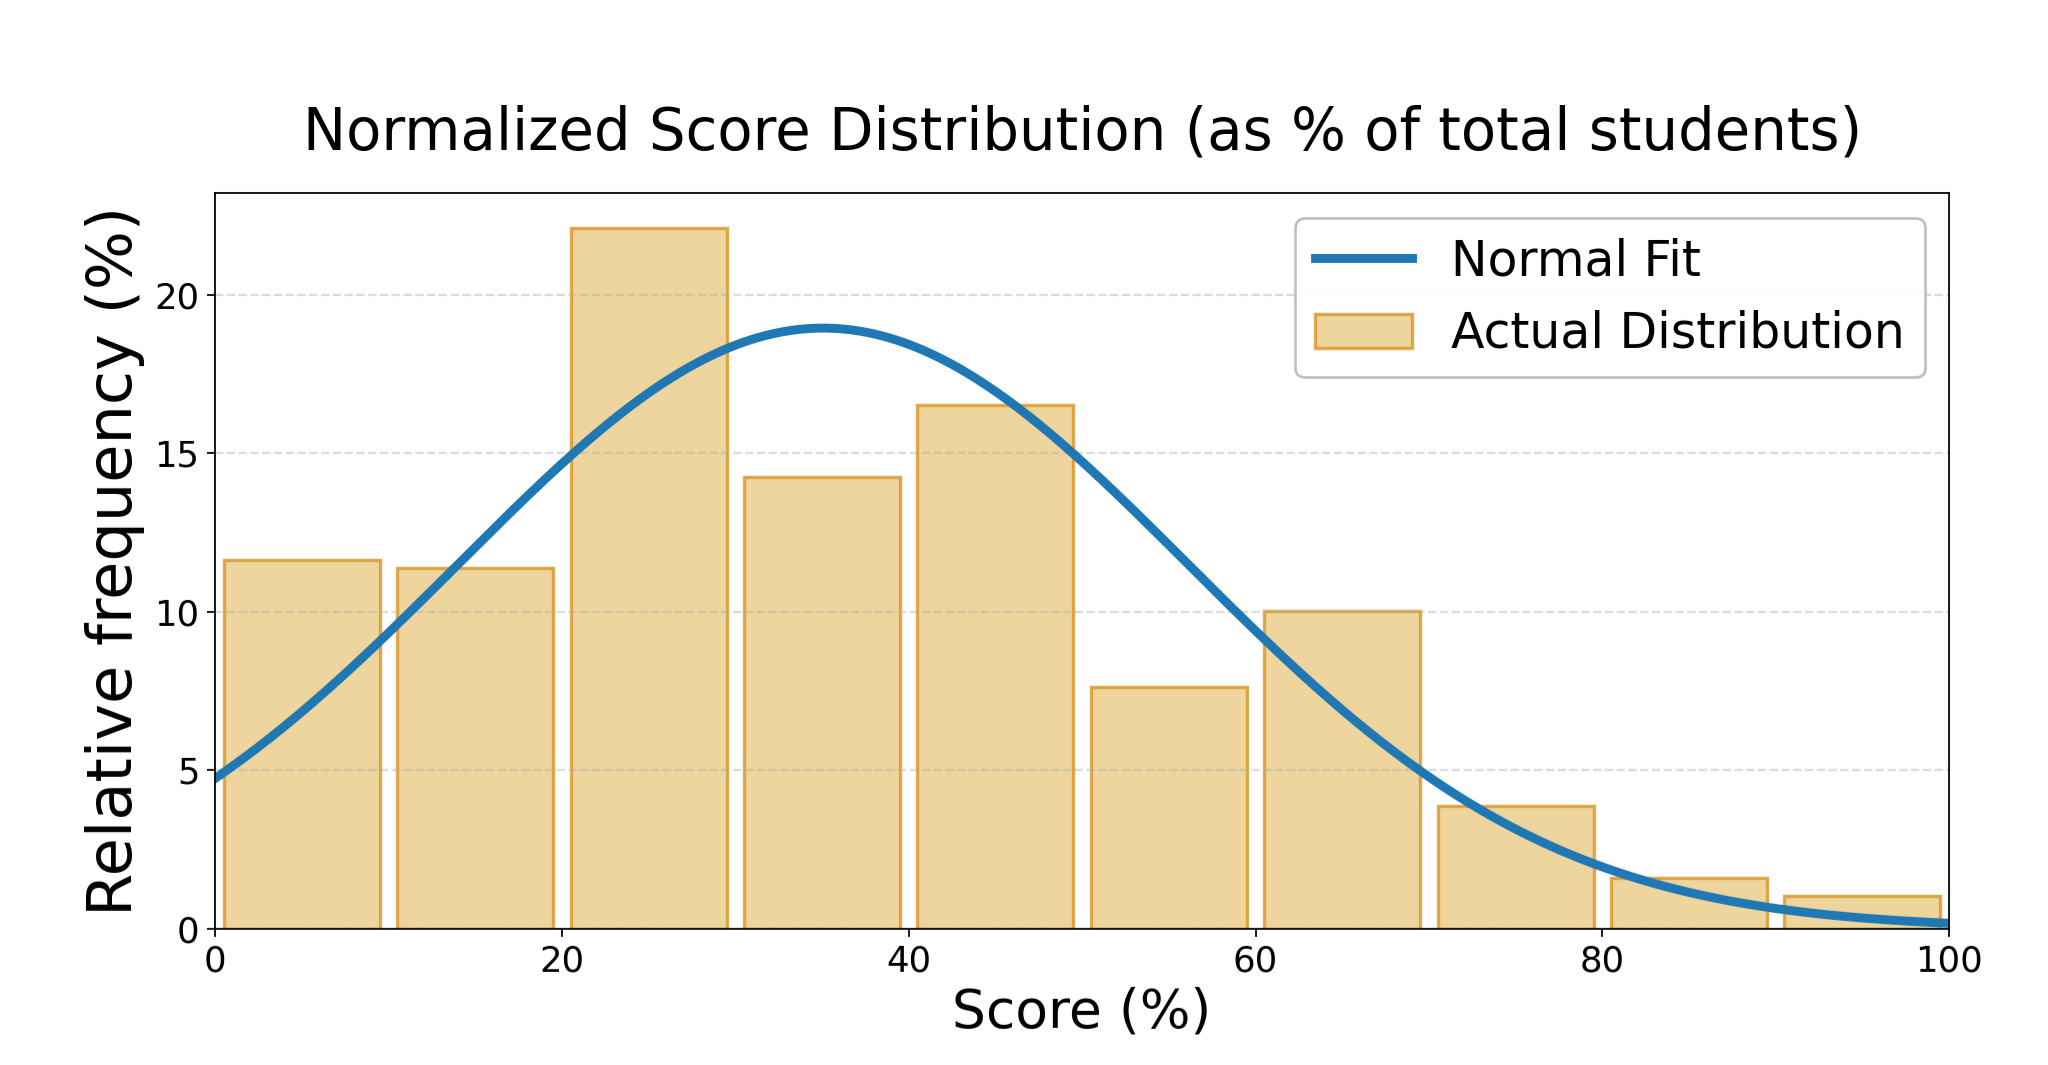
Bars show the proportion of students per score range; curve shows normal fit.
Grade 7 Top Math Stars
| Rank | Student | School | City | Province/State | Country |
|---|---|---|---|---|---|
| 1 | Sophie L. | Collingwood School | West Vancouver | British Columbia | Canada |
| 2 | Akshaj S. | Académie Ste-Cécile International School | Windsor | Ontario | Canada |
| 3 | Karly D. | Fred C. Cook | Bradford | Ontario | Canada |
| 4 | Amelia J. | Académie Ste-Cécile International School | Windsor | Ontario | Canada |
| 5 | Helen G. | Sandwich West Public School | Lasalle | Ontario | Canada |
| 6 | Mahsa H. | Fred C. Cook | Bradford | Ontario | Canada |
| 7 | Amy Y. | Fred C. Cook | Bradford | Ontario | Canada |
| 8 | Jessica W. | Collingwood School | West Vancouver | British Columbia | Canada |
| 9 | Antus L. | Collingwood School | West Vancouver | British Columbia | Canada |
| 10 | Jason L. | Lincoln Academy | Beloit | Wisconsin | USA |