Grade 6 National Score Analysis
Key percentile cutoffs and distribution overview for the October 2025 ICMC results.
Top 1%
≥ 80
Top 5%
≥ 68
Top 10%
≥ 64
Top 25%
≥ 52
Five-Number Summary
| Minimum | Q1 (25%) | Median | Q3 (75%) | Maximum |
|---|---|---|---|---|
| 0 | 32 | 44 | 52 | 96 |
Normalized Score Distribution
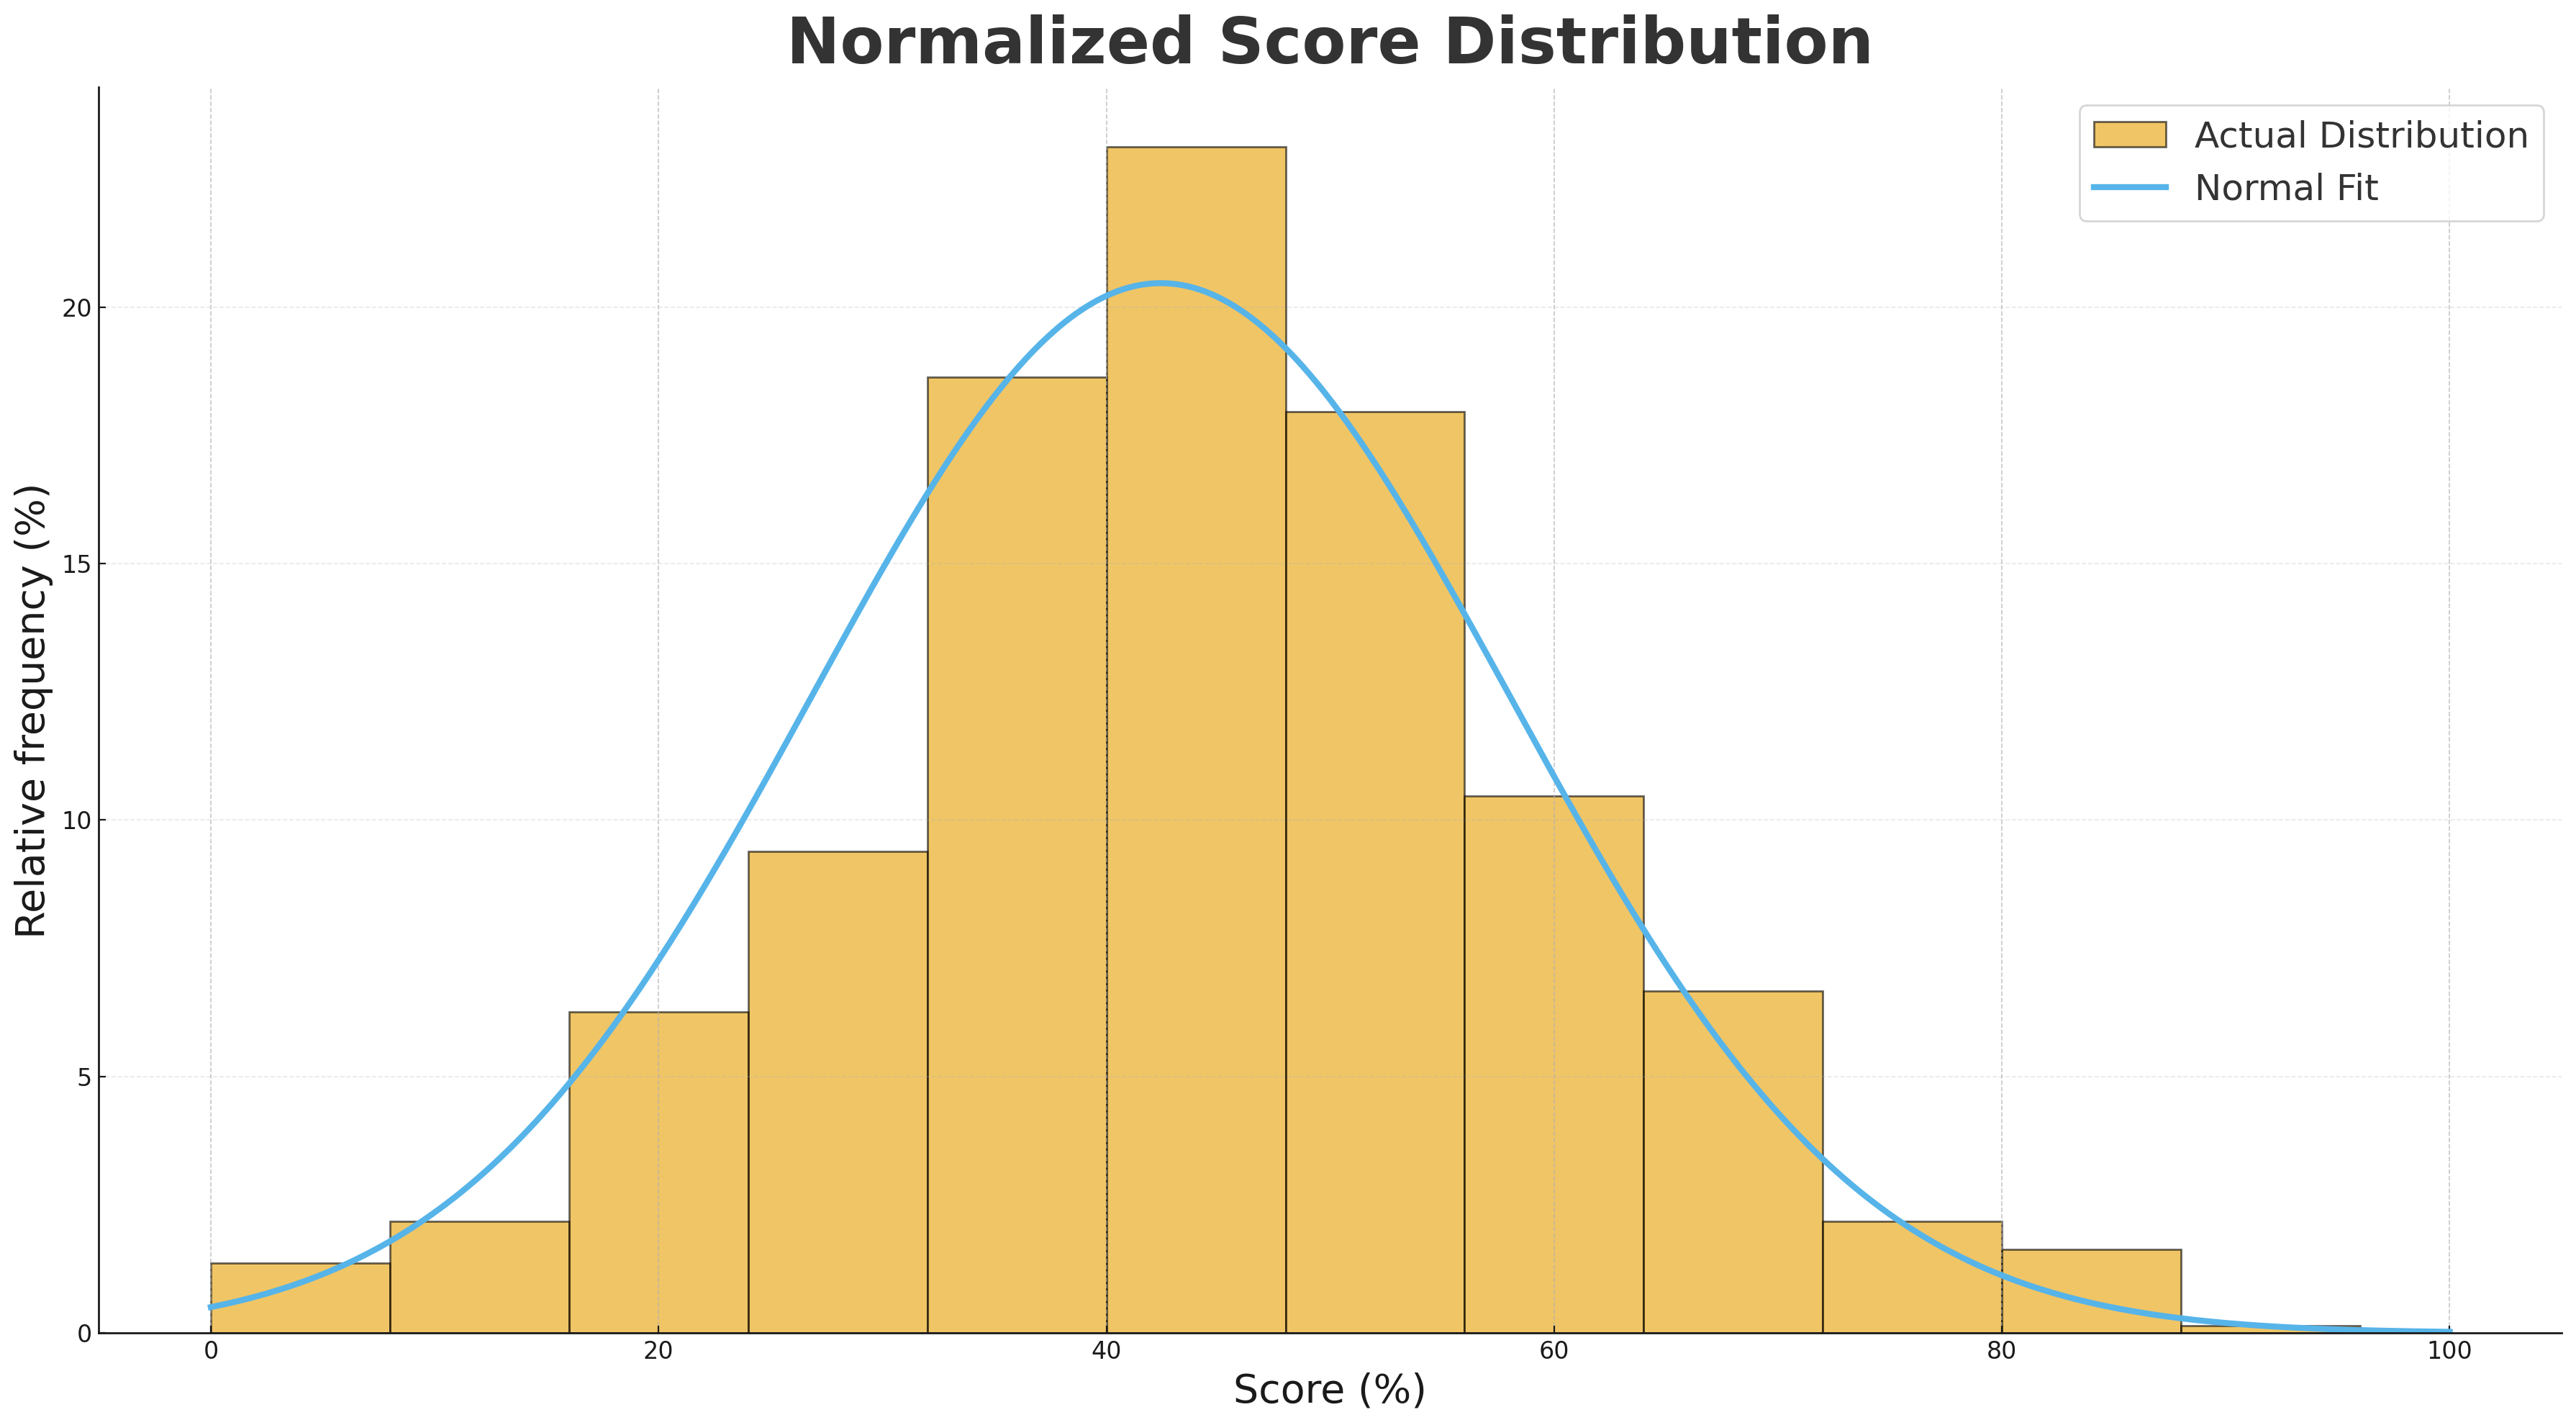
Bars show the proportion of students per score range; curve shows normal fit.
Grade 6 Top 10 Math Stars
| Rank | Student | School | City | Province/State | Country |
|---|---|---|---|---|---|
| 1 | Daanya S. | Math Competition Coaching | Ashburn | Virginia | USA |
| 2 | Darsh D. | Math Competition Coaching | Ashburn | Virginia | USA |
| 3 | Rio Y. | Holy Cross Catholic Elementary School | Windsor | Ontario | Canada |
| 4 | Noah K. | New Horizons School | Sherwood Park | Alberta | Canada |
| 5 | Helen G. | Sandwich West Public School | Lasalle | Ontario | Canada |
| 6 | Quinton P. | New Horizons School | Sherwood Park | Alberta | Canada |
| 7 | Sophia W. | Fairview Public School | Mississauga | Ontario | Canada |
| 8 | Avika J. | Math Competition Coaching | Ashburn | Virginia | USA |
| 9 | Ayaan P. | Math Competition Coaching | Ashburn | Virginia | USA |
| 10 | Ty O. | Sandwich West Public School | Lasalle | Ontario | Canada |