Grade 6 National Score Analysis
Key percentile cutoffs and distribution overview for the November 2025 ICMC results.
Top 1%
≥ 80
Top 5%
≥ 64
Top 10%
≥ 56
Top 25%
≥ 44
Five-Number Summary
| Minimum | Q1 (25%) | Median | Q3 (75%) | Maximum |
|---|---|---|---|---|
| 0 | 28 | 36 | 44 | 92 |
Normalized Score Distribution
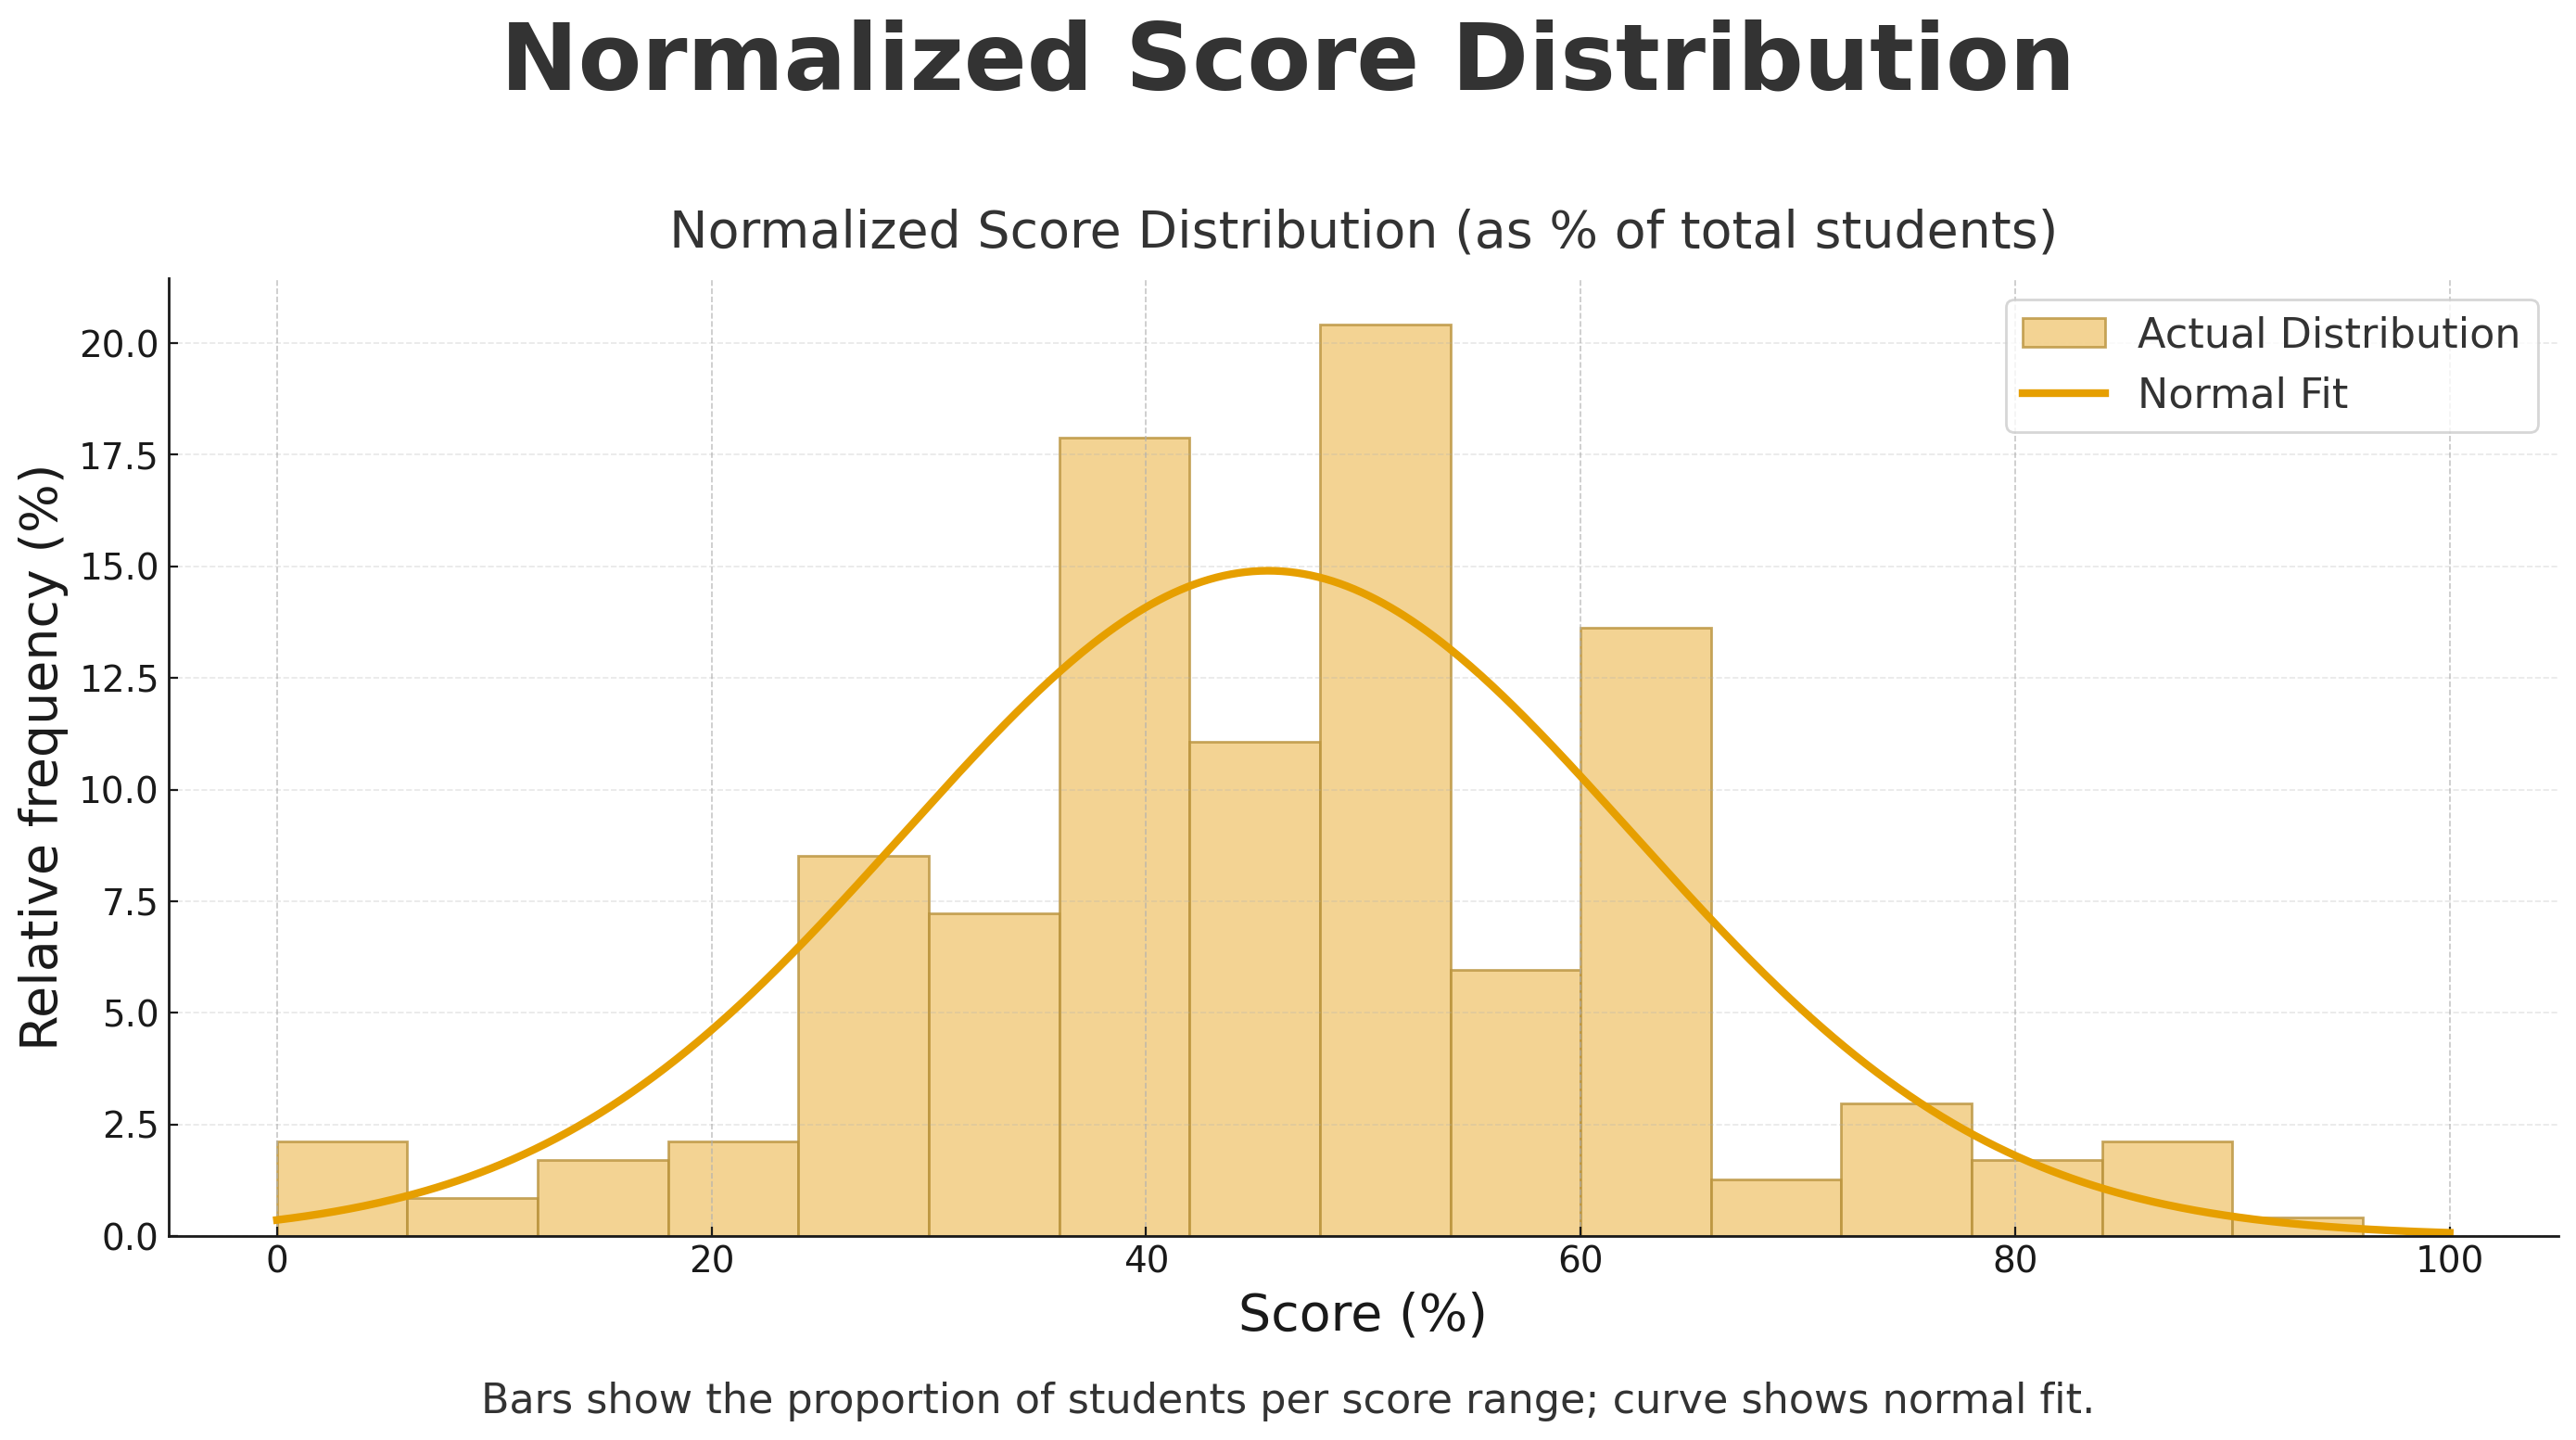
Bars show the proportion of students per score range; curve shows normal fit.
Grade 6 Top 10 Math Stars
| Rank | Student | School | City | Province/State | Country |
|---|---|---|---|---|---|
| 1 | Darsh D. | Math Competition Coaching | Ashburn | Virginia | USA |
| 2 | Simon Y. | Collingwood School | West Vancouver | British Columbia | Canada |
| 3 | Amelia Z. | Collingwood School | West Vancouver | British Columbia | Canada |
| 4 | Sophia W. | Collingwood School | West Vancouver | British Columbia | Canada |
| 5 | Wesley C. | Collingwood School | West Vancouver | British Columbia | Canada |
| 6 | Quinton Q. | New Horizons School | Sherwood Park | Alberta | Canada |
| 7 | Anna W. | Holy Cross Catholic Elementary School | Windsor | Ontario | Canada |
| 8 | Aiden O. | Pineland P.S. | Burlington | Ontario | Canada |
| 9 | Brayden B. | Halton Hills Christian School | Georgetown | Ontario | Canada |
| 10 | Alexander A. | Halton Hills Christian School | Georgetown | Ontario | Canada |