Grade 6 National Score Analysis
Key percentile cutoffs and distribution overview for the January 2026 ICMC results.
Top 1%
≥ 84
Top 5%
≥ 72
Top 10%
≥ 61
Top 25%
≥ 51
Five-Number Summary
| Minimum | Q1 (25%) | Median | Q3 (75%) | Maximum |
|---|---|---|---|---|
| 0 | 29 | 39 | 51 | 96 |
Normalized Score Distribution
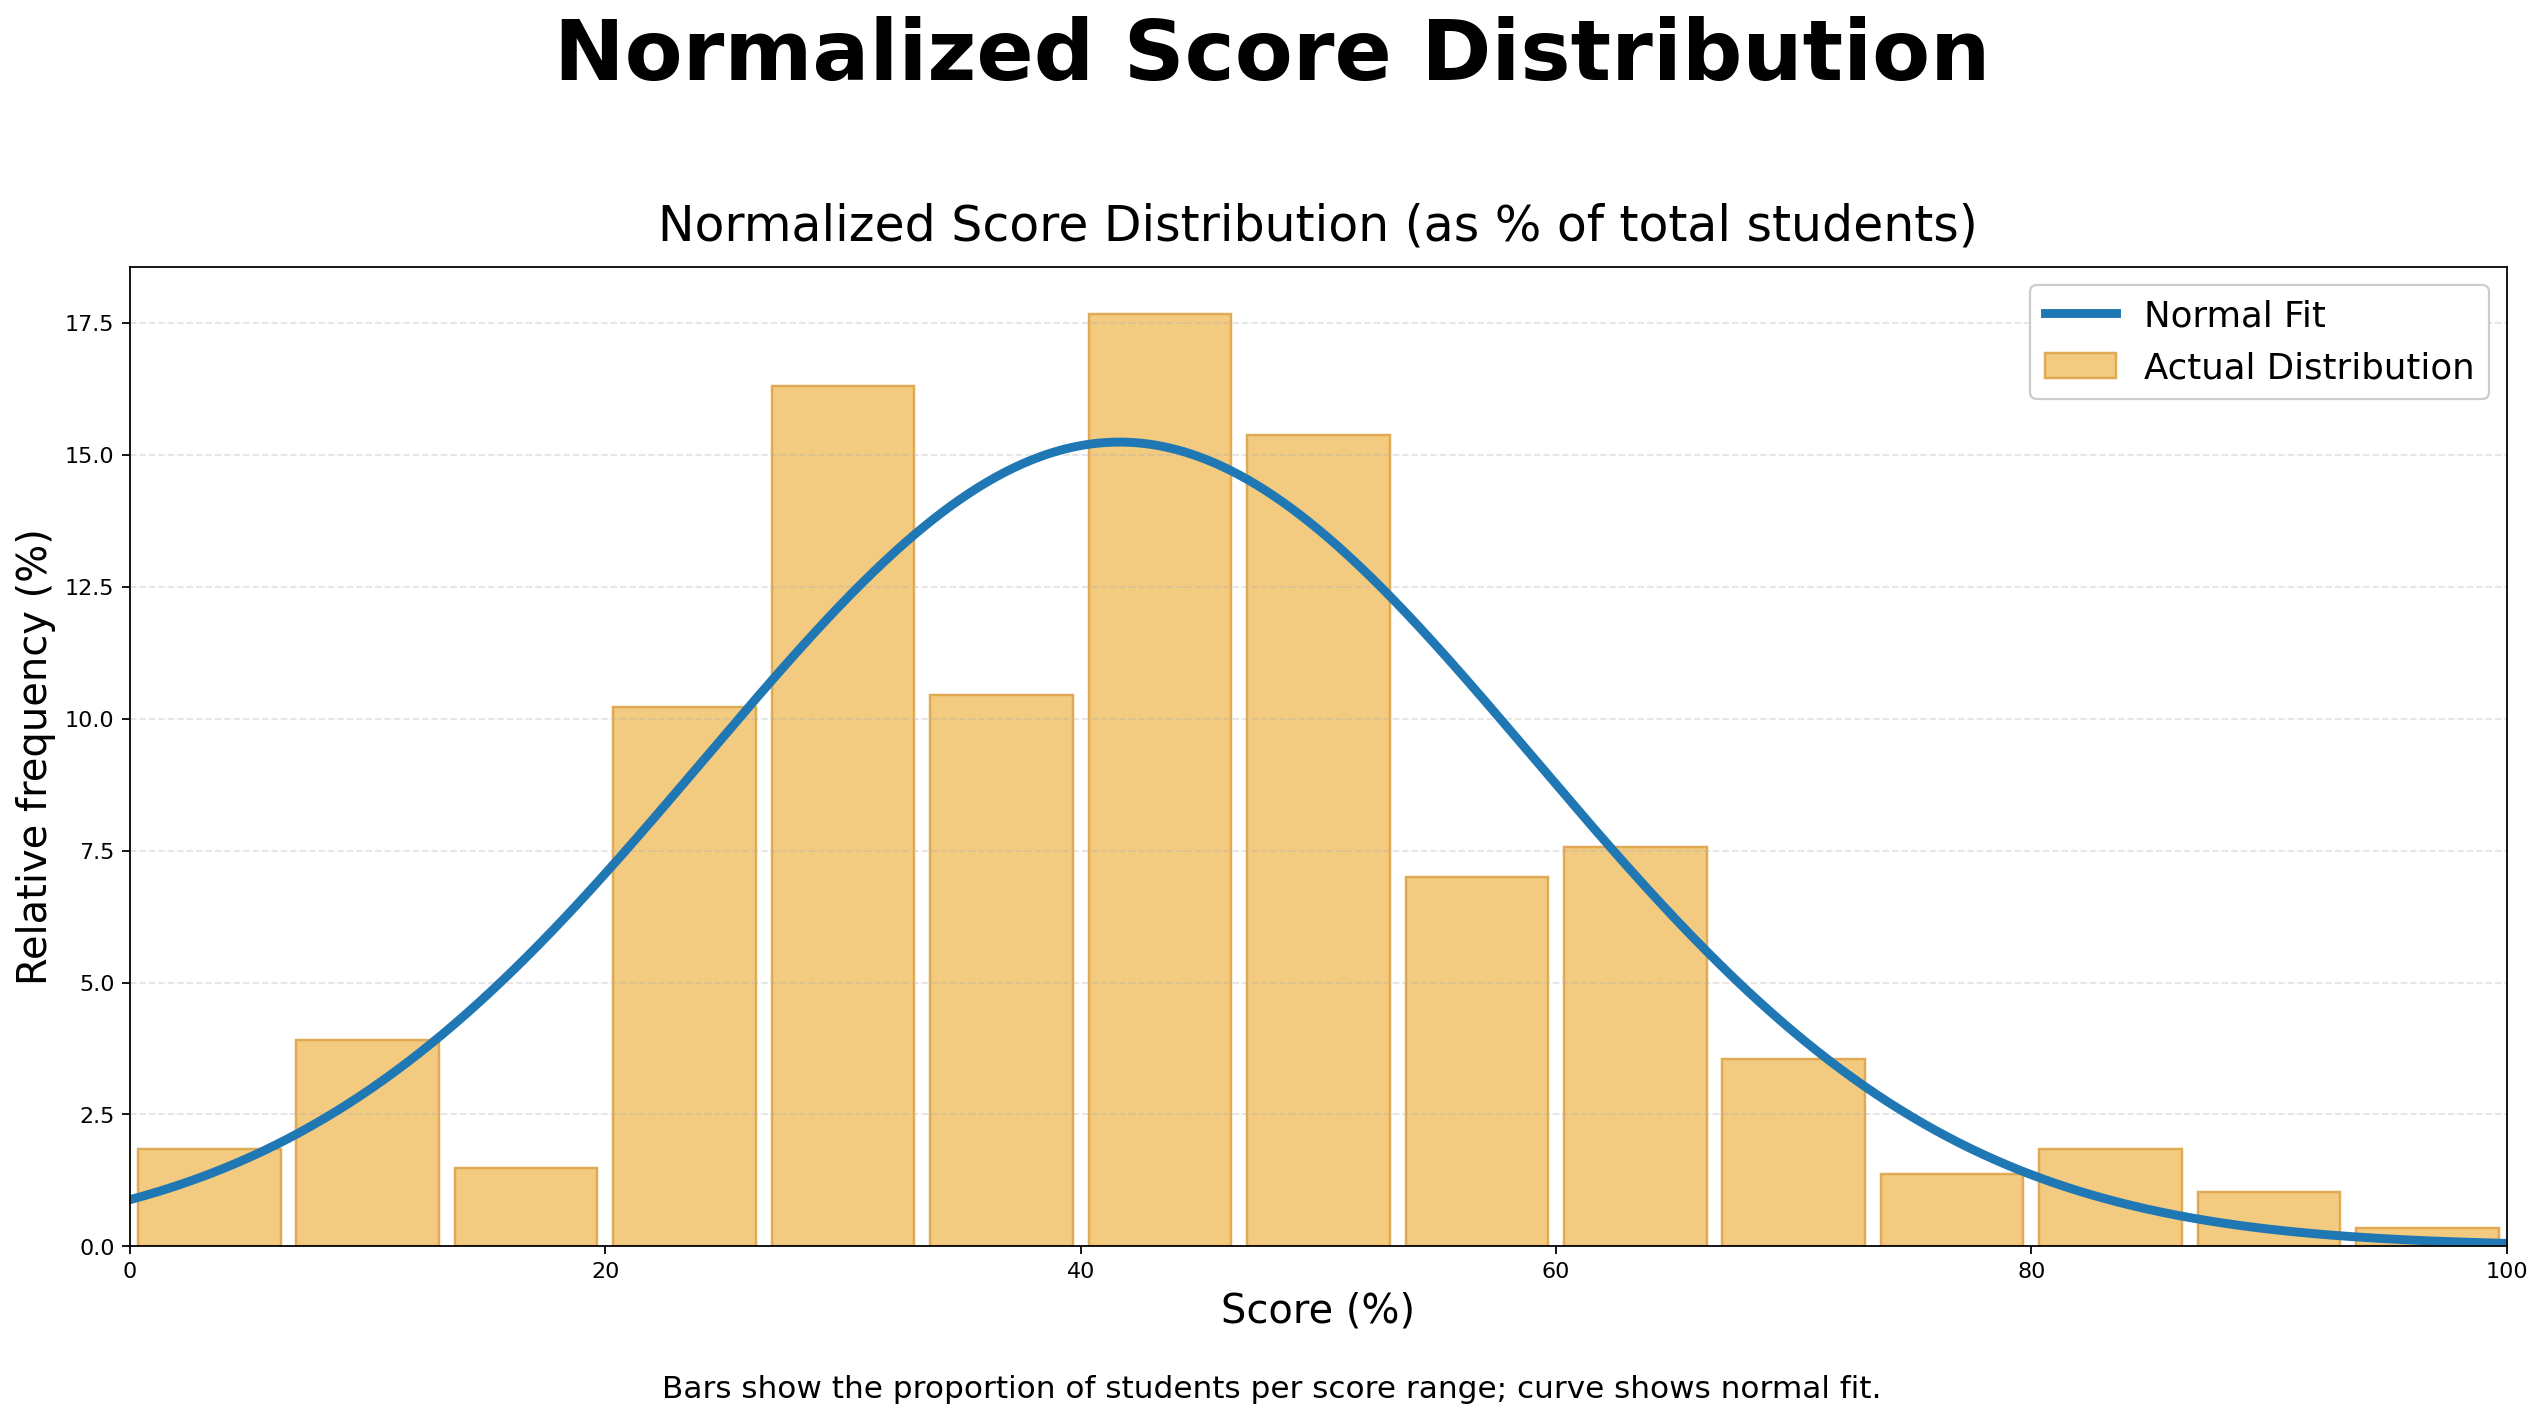
Bars show the proportion of students per score range; curve shows normal fit.
Grade 6 Top 10 Math Stars
| Rank | Student | School | City | Province/State | Country |
|---|---|---|---|---|---|
| 1 | Daanya S. | Math Competition Coaching | Ashburn | Virginia | USA |
| 2 | Ethan H. | Collingwood School | West Vancouver | British Columbia | Canada |
| 3 | Rex R. | Collingwood School | West Vancouver | British Columbia | Canada |
| 4 | Avika J. | Math Competition Coaching | Ashburn | Virginia | USA |
| 5 | Annabelle T. | Collingwood School | West Vancouver | British Columbia | Canada |
| 6 | Sisilia T. | White Rock Christian Academy | South Surrey | British Columbia | Canada |
| 7 | Benjamin T. | George Street Middle School | Fredericton | New Brunswick | Canada |
| 8 | Anna W. | Holy Cross Catholic Elementary School | Windsor | Ontario | Canada |
| 9 | Noah K. | New Horizons School | Sherwood Park | Alberta | Canada |
| 10 | Christian M. | Aurora Prep Academy | Aurora | Ontario | Canada |
| 11 | Mason G. | Queen Of All Saints Elementary School | Coquitlam | British Columbia | Canada |