Grade 5 National Score Analysis
Key percentile cutoffs and distribution overview for the January 2026 ICMC results.
Top 1%
≥ 84
Top 5%
≥ 67
Top 10%
≥ 60
Top 25%
≥ 50
Five-Number Summary
| Minimum | Q1 (25%) | Median | Q3 (75%) | Maximum |
|---|---|---|---|---|
| 0 | 26 | 38 | 50 | 96 |
Normalized Score Distribution
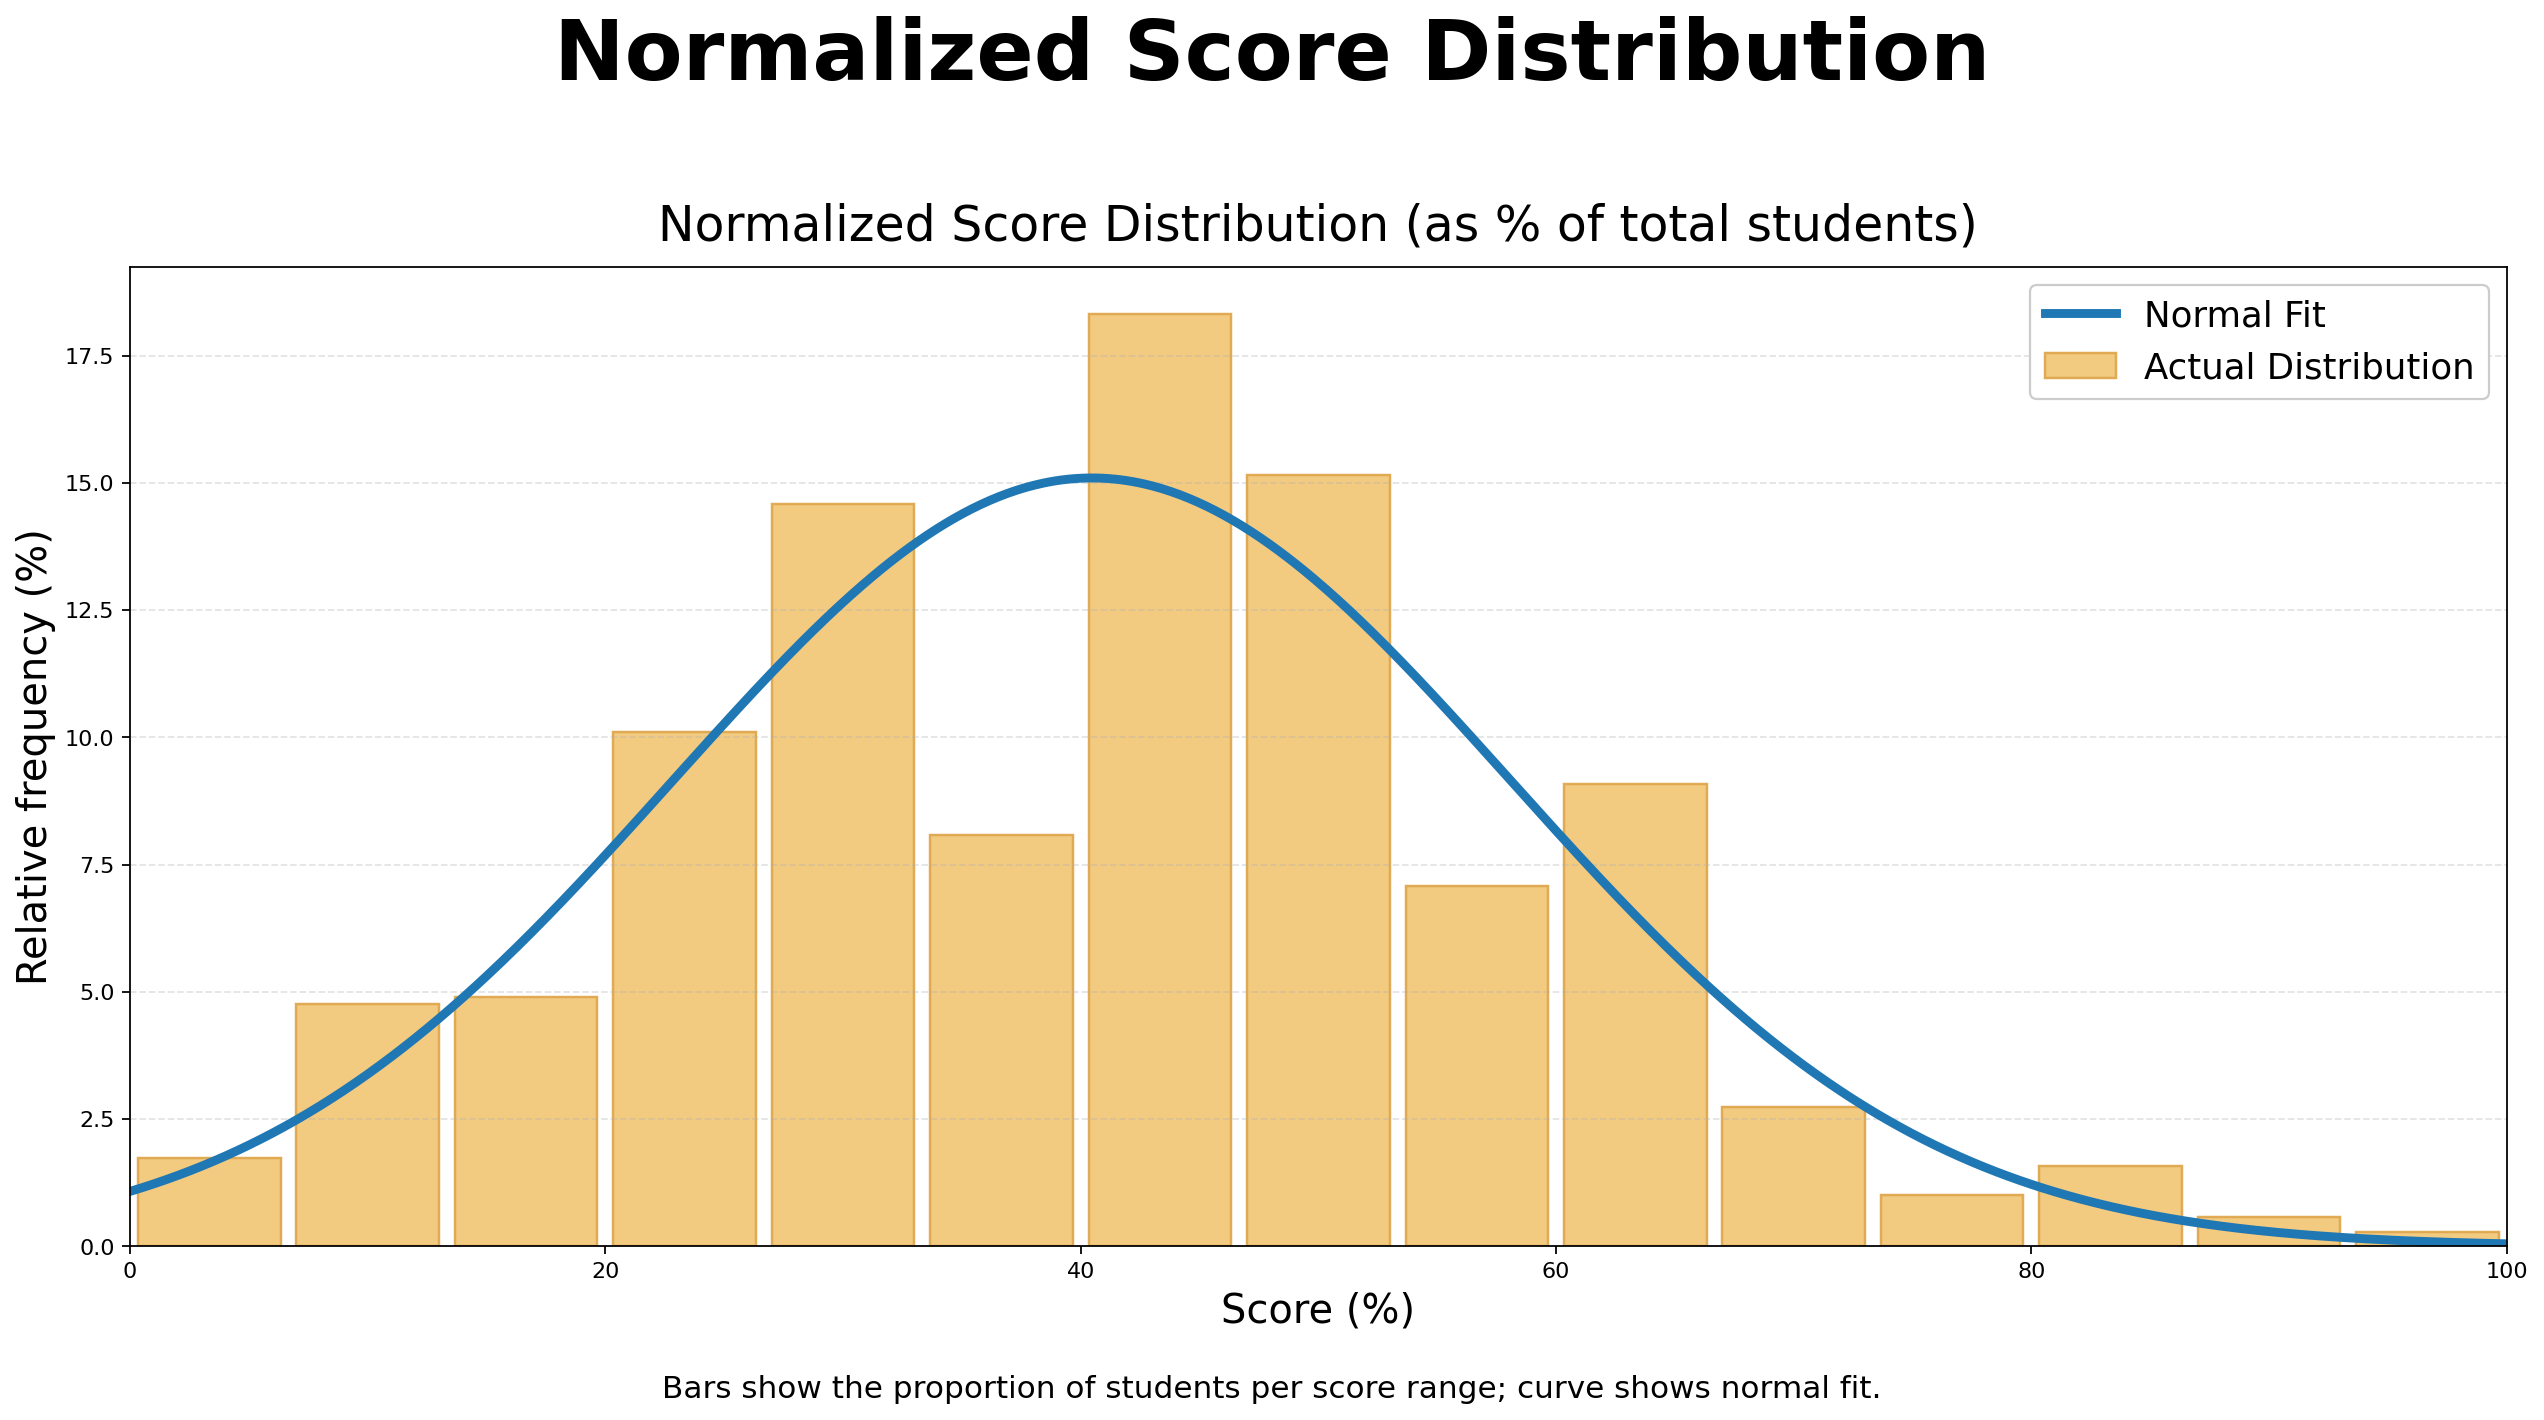
Bars show the proportion of students per score range; curve shows normal fit.
Grade 5 Top 10 Math Stars
| Rank | Student | School | City | Province/State | Country |
|---|---|---|---|---|---|
| 1 | George K. | Stella Maris Catholic Elementary School | Amherstburg | Ontario | Canada |
| 2 | Darren Z. | Collingwood School | West Vancouver | British Columbia | Canada |
| 3 | Andrew X. | École Silverspring School | Saskatoon | Saskatchewan | Canada |
| 4 | Alexander A. | St. Marguerite D’Youville | Oakville | Ontario | Canada |
| 5 | Thomas K. | Math Competition Coaching | Ashburn | Virginia | USA |
| 6 | Vivian N. | Collingwood School | West Vancouver | British Columbia | Canada |
| 7 | Siddhartha G. | Math Competition Coaching | Ashburn | Virginia | USA |
| 8 | Jenny L. | Académie Ste-Cécile International School | Windsor | Ontario | Canada |
| 9 | Rihon M. | Math Competition Coaching | Ashburn | Virginia | USA |
| 10 | Max L. | Collingwood School | West Vancouver | British Columbia | Canada |