Grade 5 National Score Analysis
Key percentile cutoffs and distribution overview for the April 2026 ICMC results.
Top 1%
≥ 88
Top 5%
≥ 76
Top 10%
≥ 70
Top 25%
≥ 58
Five-Number Summary
| Minimum | Q1 (25%) | Median | Q3 (75%) | Maximum |
|---|---|---|---|---|
| 0 | 19 | 33 | 58 | 100 |
Normalized Score Distribution
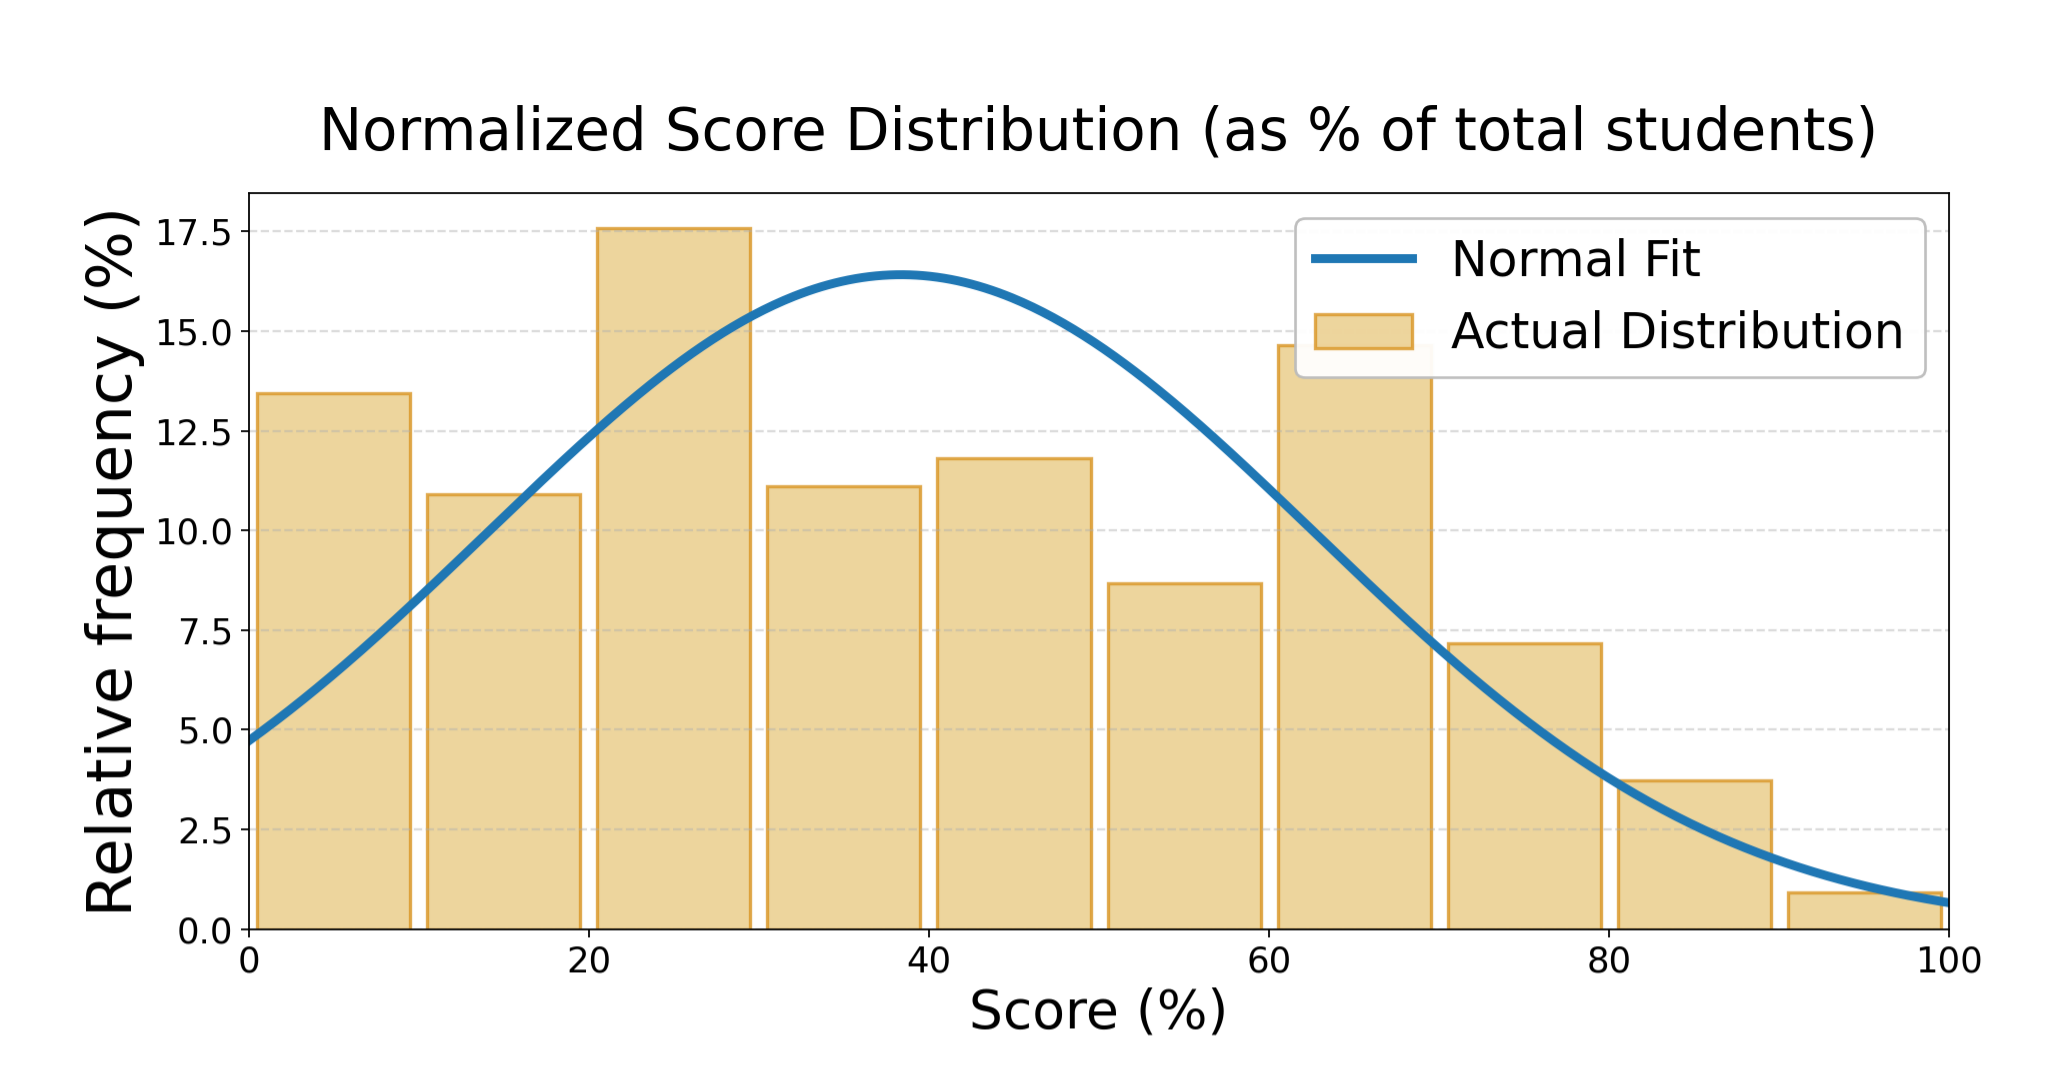
Bars show the proportion of students per score range; curve shows normal fit.
Grade 5 Top Math Stars
| Rank | Student | School | City | Province/State | Country |
|---|---|---|---|---|---|
| 1 | Suixin H. | Beijing Haidian Foreign Language Experimental School | Qionghai | Hainan | China |
| 2 | Rich L. | St. John Vianney | Windsor | Ontario | Canada |
| 3 | Darren Z. | Collingwood School | West Vancouver | British Columbia | Canada |
| 4 | George K. | Stella Maris Catholic Elementary School | Amherstburg | Ontario | Canada |
| 5 | Hao Q. | Sandwich West Public School | Lasalle | Ontario | Canada |
| 6 | Thomas Jude K. | Math Competition Coaching | Ashburn | Virginia | USA |
| 7 | Max L. | Collingwood School | West Vancouver | British Columbia | Canada |
| 8 | Jason C. | Collingwood School | West Vancouver | British Columbia | Canada |
| 9 | Jayden W. | Aberdeen Hall | Kelowna | British Columbia | Canada |
| 10 | Ali H. | Cottingham Junior Public School | Toronto | Ontario | Canada |