Grade 4 National Score Analysis
Key percentile cutoffs and distribution overview for the November 2025 ICMC results.
Top 1%
≥ 75
Top 5%
≥ 66
Top 10%
≥ 58
Top 25%
≥ 45
Five-Number Summary
| Minimum | Q1 (25%) | Median | Q3 (75%) | Maximum |
|---|---|---|---|---|
| 0 | 25 | 33 | 45 | 87 |
Normalized Score Distribution
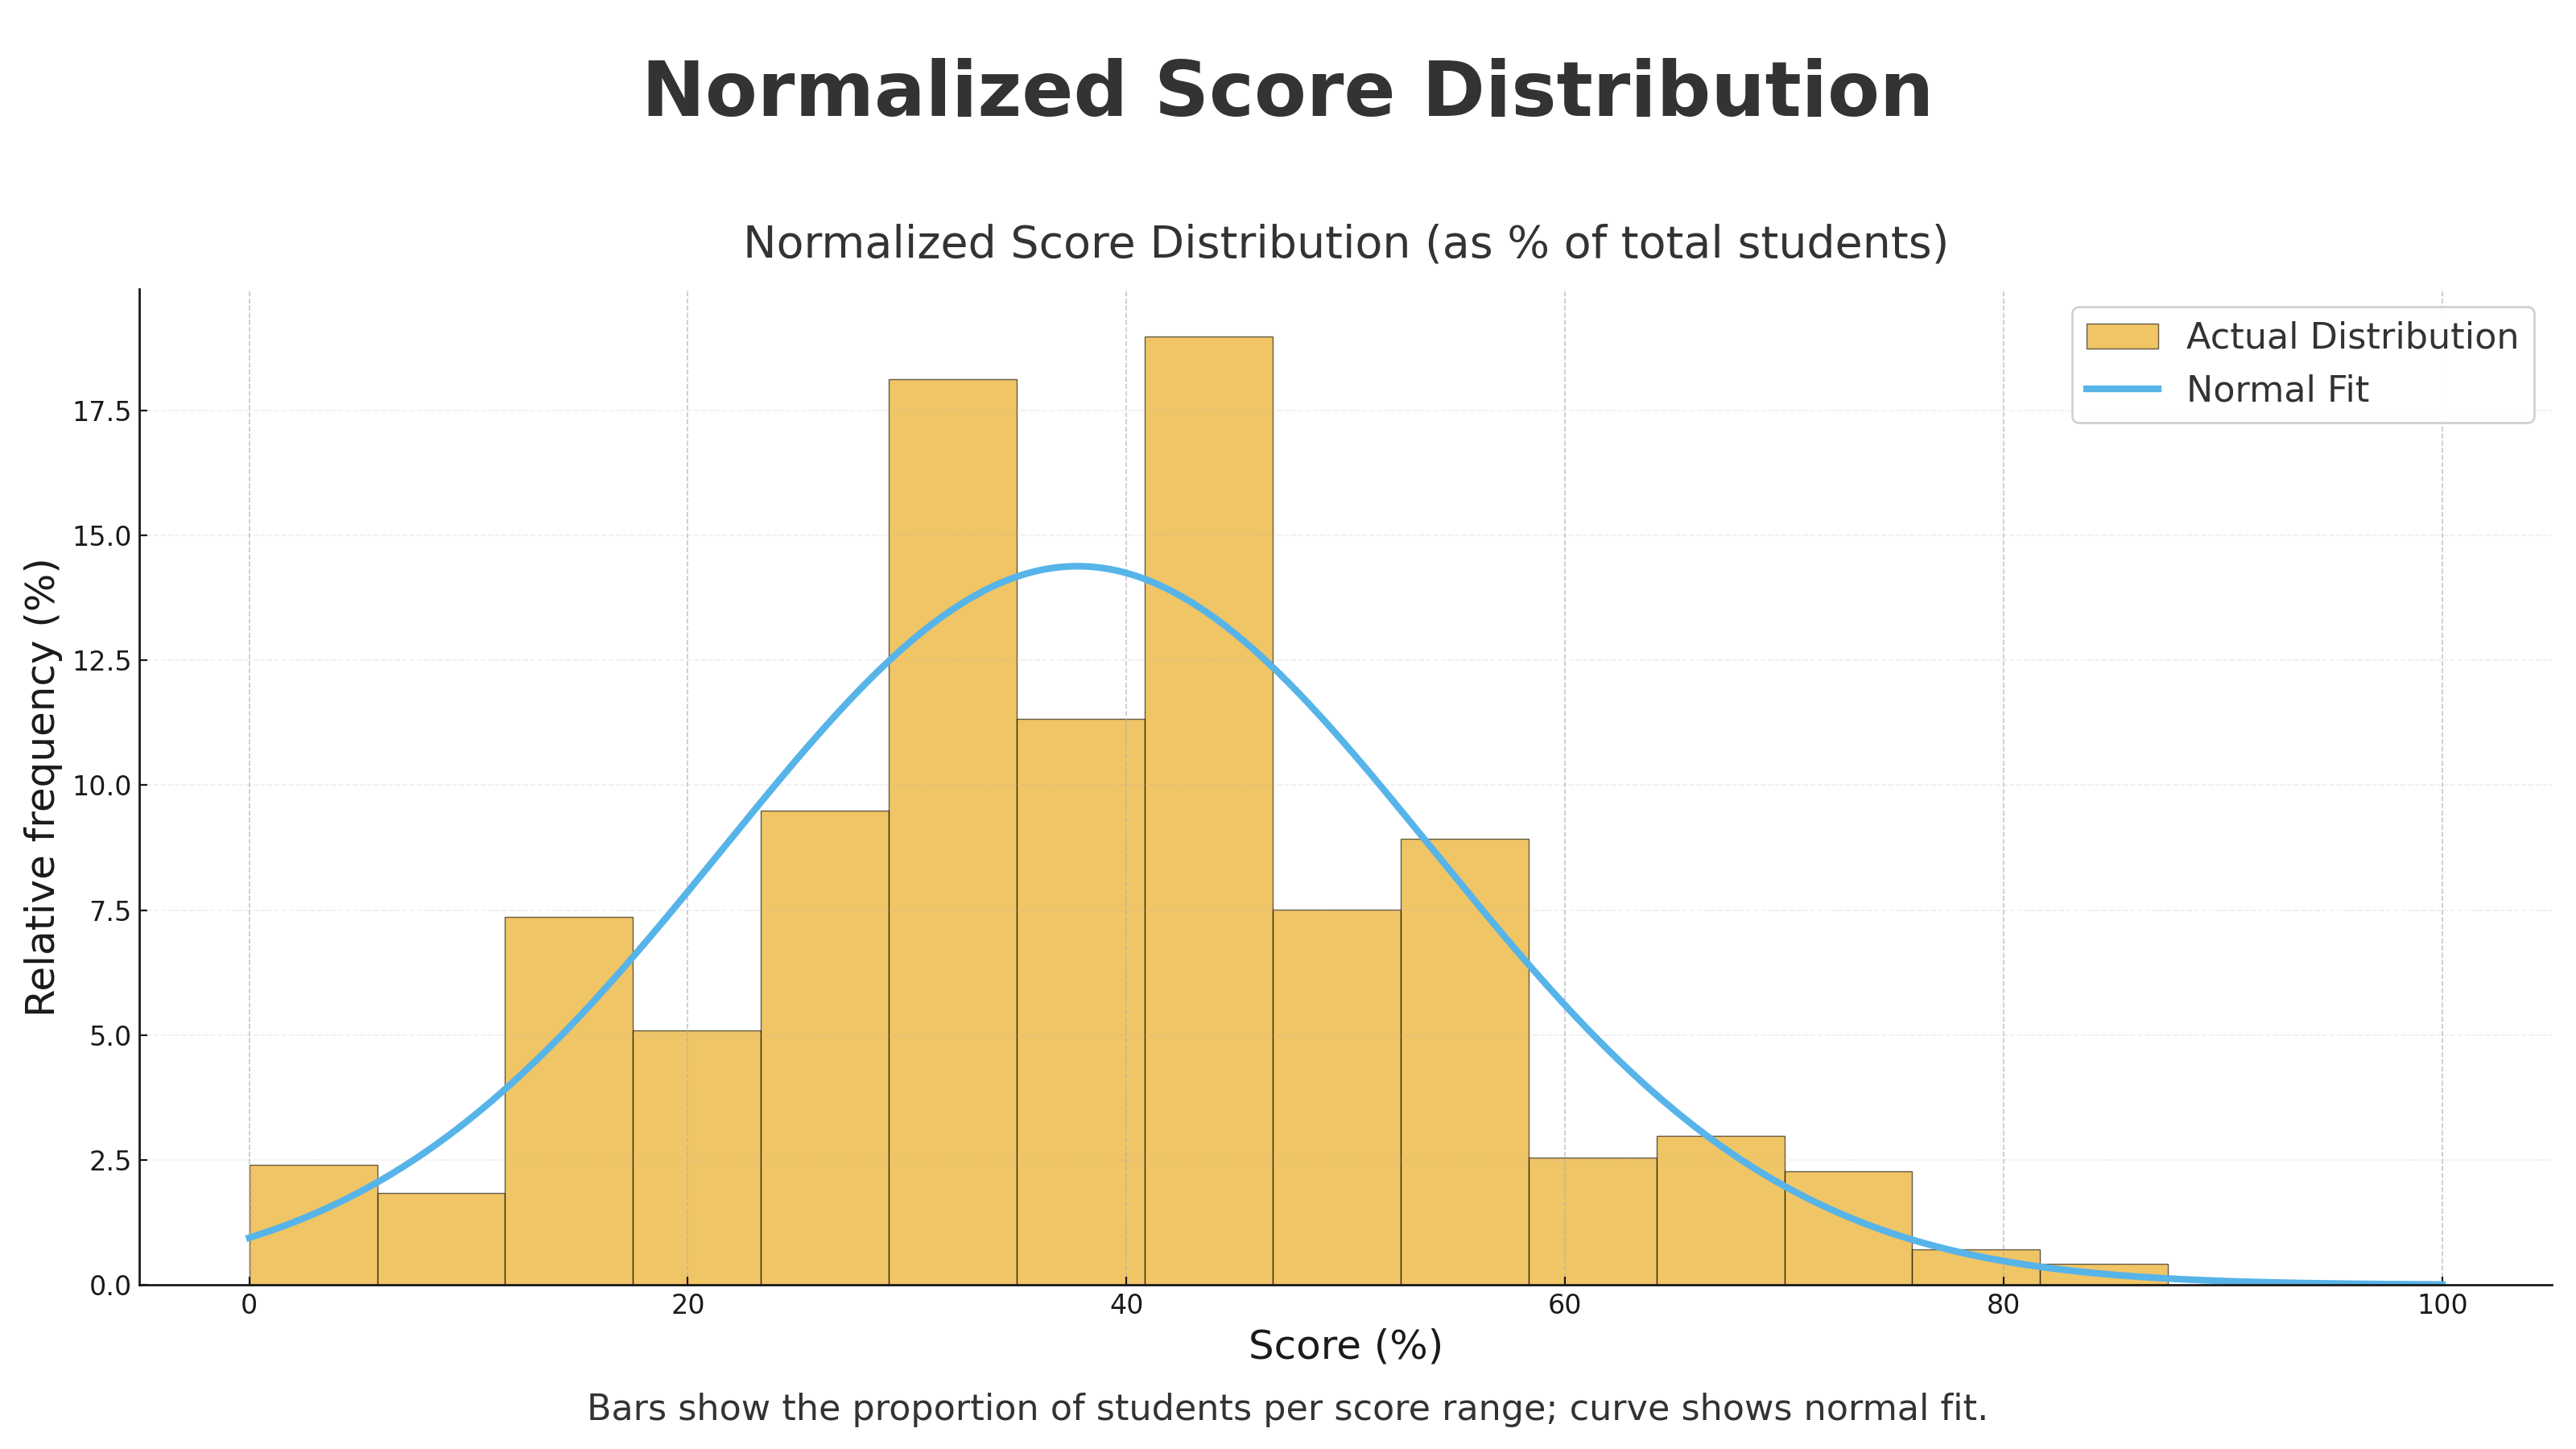
Bars show the proportion of students per score range; curve shows normal fit.
Grade 4 Top 10 Math Stars
| Rank | Student | School | City | Province/State | Country |
|---|---|---|---|---|---|
| 1 | Jiami Z. | St. Joseph Catholic Elementary School | Amherstburg | Ontario | Canada |
| 2 | Charles Z. | Collingwood School | West Vancouver | British Columbia | Canada |
| 3 | Nainika G. | Math Competition Coaching | Ashburn | Virginia | USA |
| 4 | Ayden A. | New Horizons School | Sherwood Park | Alberta | Canada |
| 5 | Joshua A. | Marigold Elementary | Victoria | British Columbia | Canada |
| 6 | Blake B. | Halton Hills Christian School | Georgetown | Ontario | Canada |
| 7 | Adam E. | Holy Cross Catholic Elementary School | Lasalle | Ontario | Canada |
| 8 | Yuna L. | Sandwich West Public School | Lasalle | Ontario | Canada |
| 9 | Nina B. | Leo Baeck Day School | Toronto | Ontario | Canada |
| 10 | Simone Z. | Queen Of All Saints Elementary School | Coquitlam | British Columbia | Canada |