Grade 4 National Score Analysis
Key percentile cutoffs and distribution overview for the April 2026 ICMC results.
Top 1%
≥ 91
Top 5%
≥ 78
Top 10%
≥ 73
Top 25%
≥ 58
Five-Number Summary
| Minimum | Q1 (25%) | Median | Q3 (75%) | Maximum |
|---|---|---|---|---|
| 0 | 20 | 35 | 58 | 100 |
Normalized Score Distribution
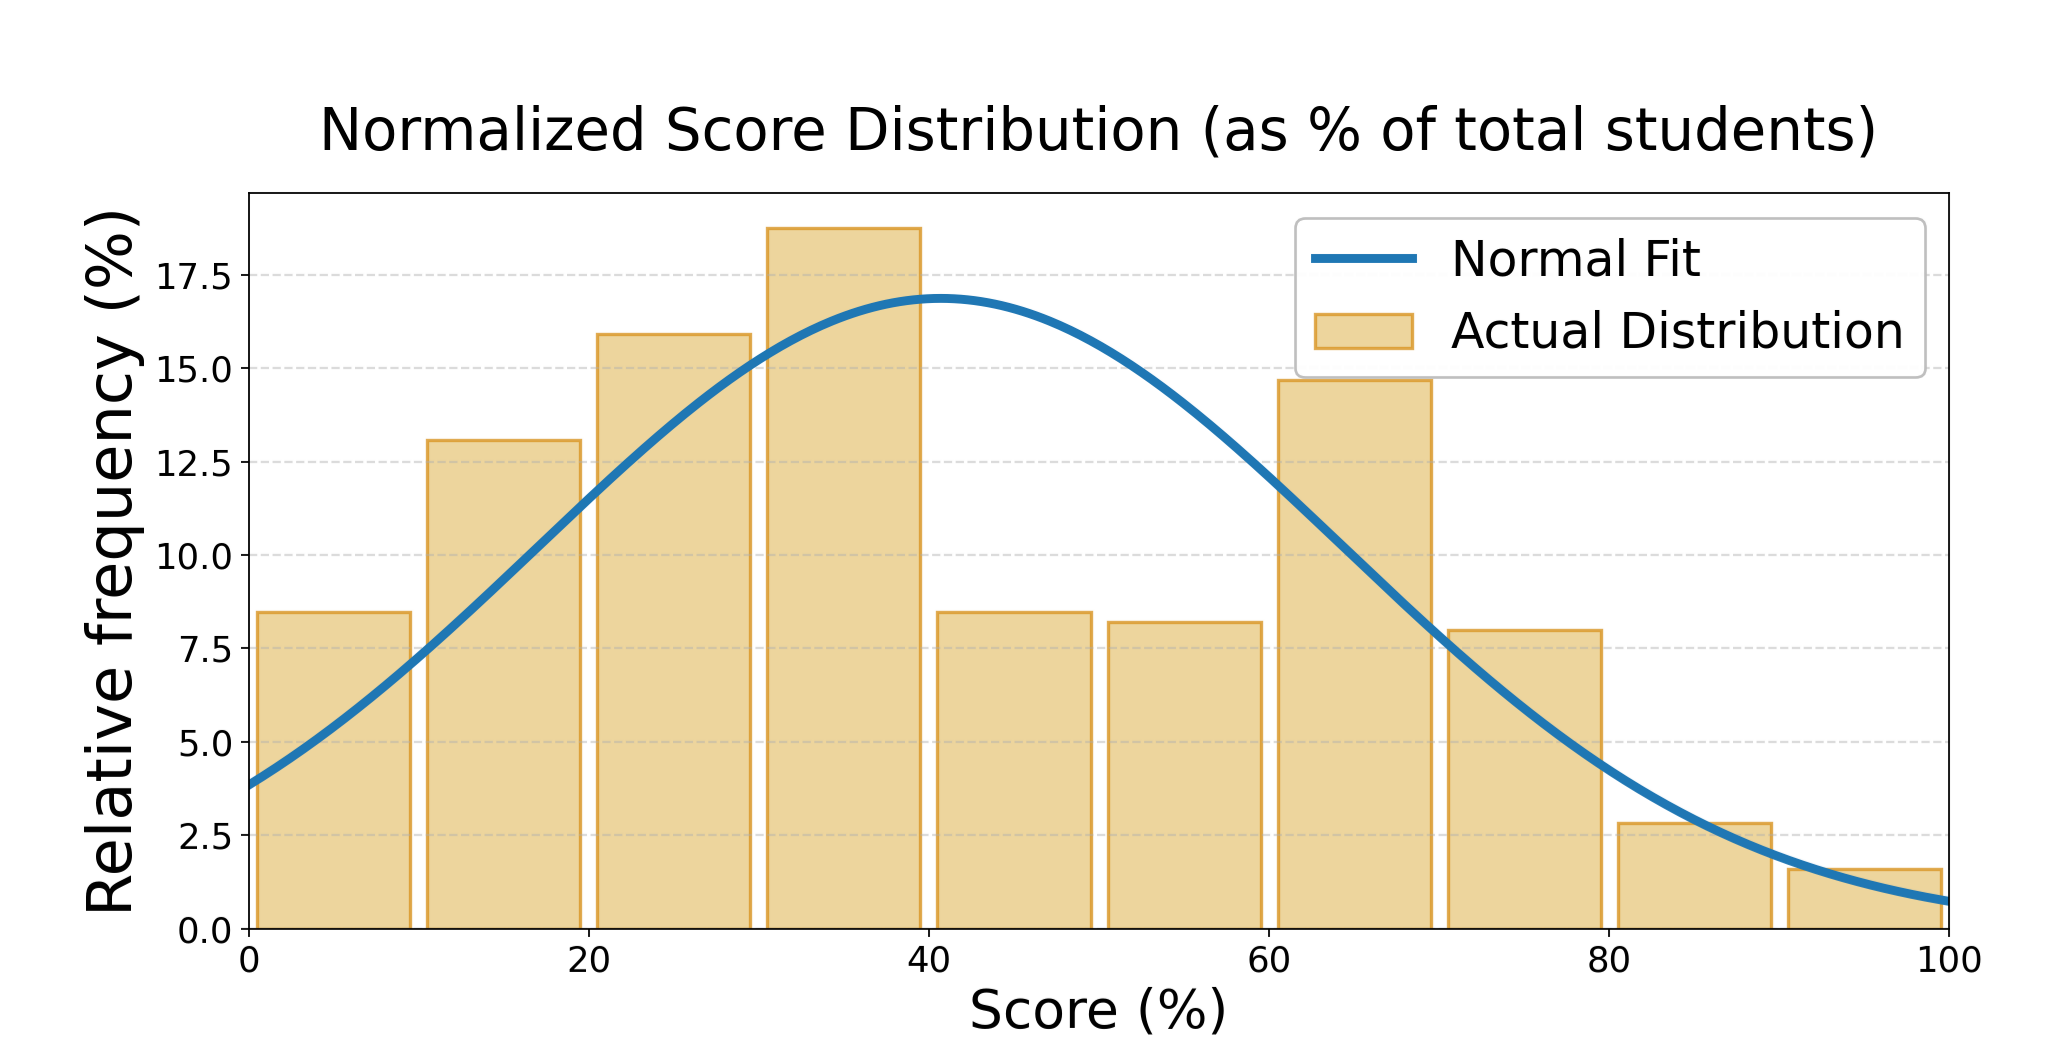
Bars show the proportion of students per score range; curve shows normal fit.
Grade 4 Top Math Stars
| Rank | Student | School | City | Province/State | Country |
|---|---|---|---|---|---|
| 1 | Nainika G. | Math Competition Coaching | Ashburn | Virginia | USA |
| 2 | Jacqueline S. | Collingwood School | West Vancouver | British Columbia | Canada |
| 3 | Charlotte H. | Sandwich West Public School | Lasalle | Ontario | Canada |
| 4 | Elliott M. | Marigold Elementary | Victoria | British Columbia | Canada |
| 5 | Sebastian K. | St. Marguerite D'Youville | Oakville | Ontario | Canada |
| 6 | Artas S. | Mulgrave School | West Vancouver | British Columbia | Canada |
| 7 | Vihear Iain V. | EJSMS | Colwood | British Columbia | Canada |
| 8 | Evan C. | Rosedale Junior Public School | Toronto | Ontario | Canada |
| 9 | Jacob L. | Mountsfield Public School | London | Ontario | Canada |
| 10 | Carol P. | Our Lady of Perpetual Help Catholic School | Toronto | Ontario | Canada |