Grade 3 National Score Analysis
Key percentile cutoffs and distribution overview for the April 2026 ICMC results.
Top 1%
≥ 82
Top 5%
≥ 73
Top 10%
≥ 66
Top 25%
≥ 51
Five-Number Summary
| Minimum | Q1 (25%) | Median | Q3 (75%) | Maximum |
|---|---|---|---|---|
| 0 | 20 | 33 | 51 | 100 |
Normalized Score Distribution
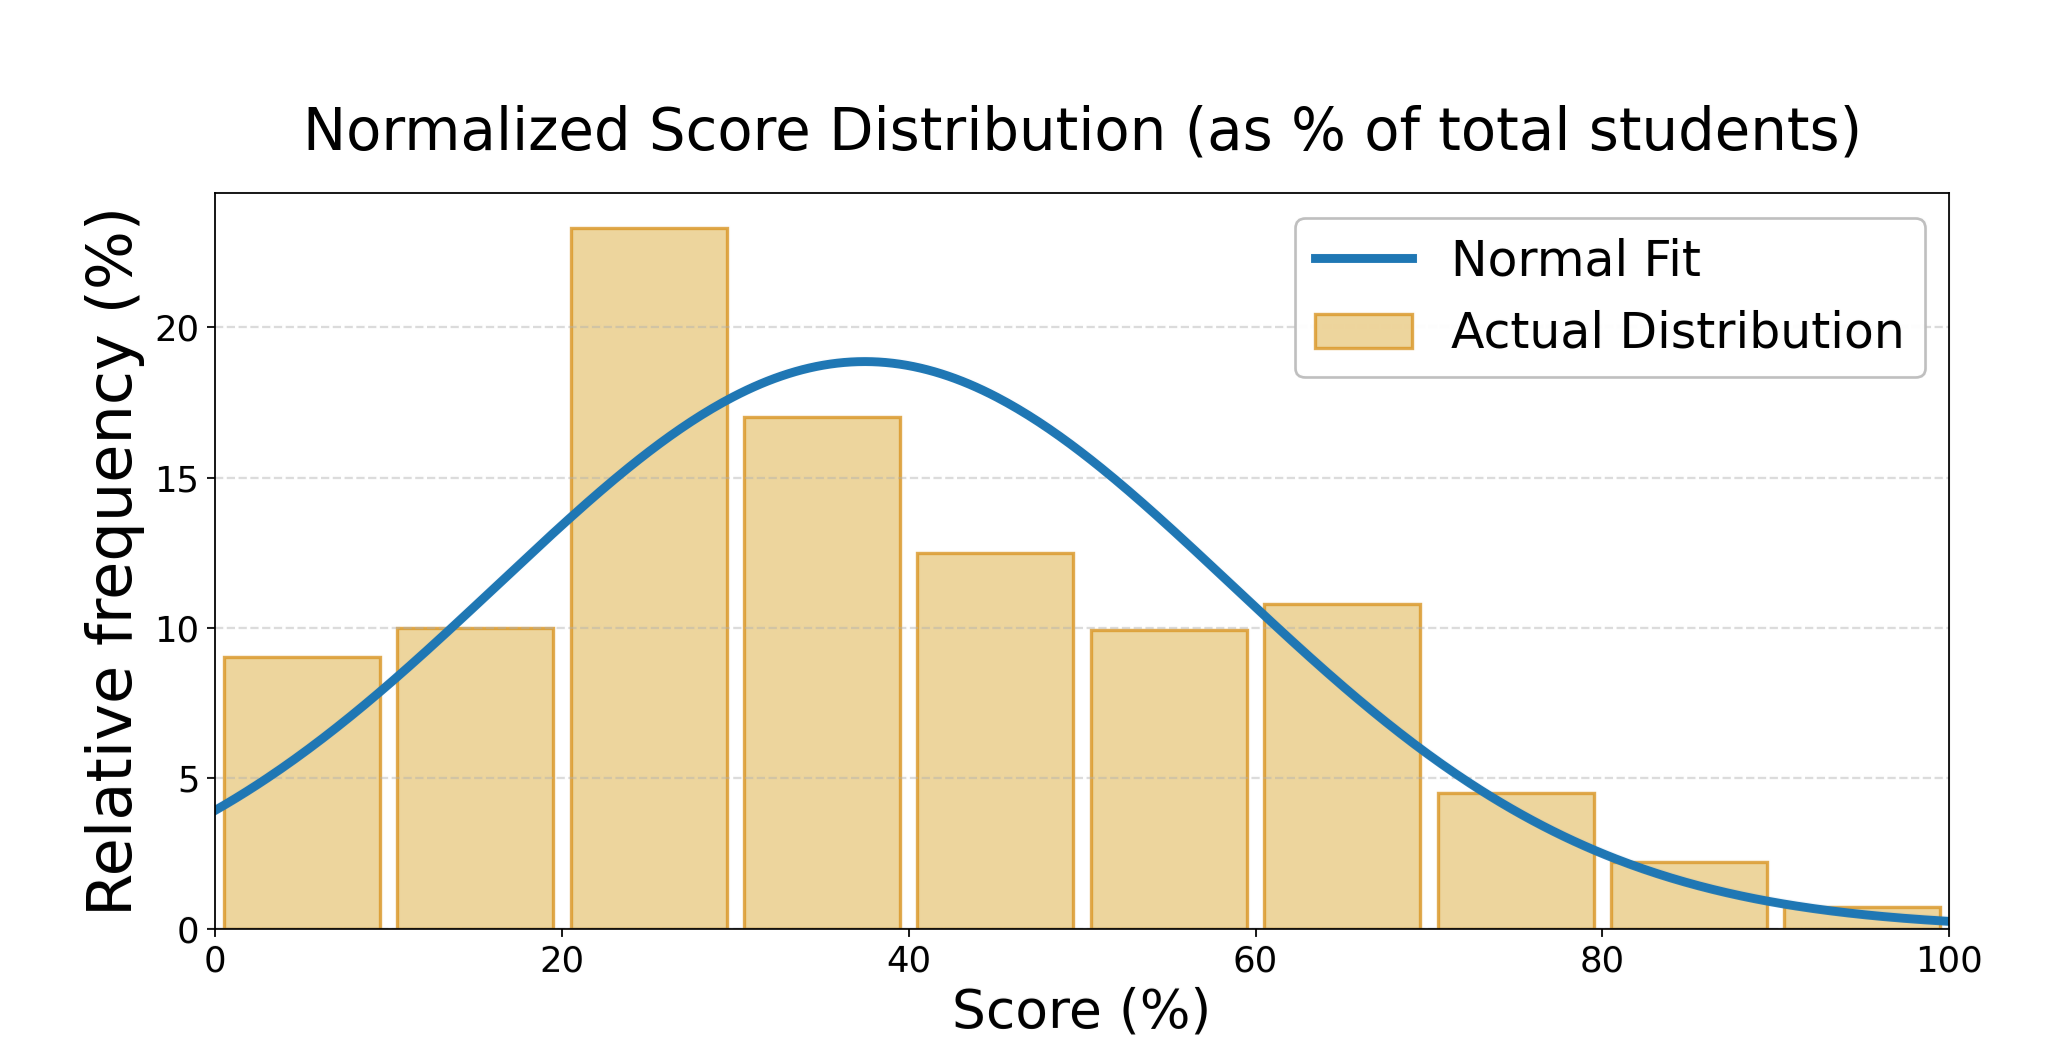
Bars show the proportion of students per score range; curve shows normal fit.
Grade 3 Top Math Stars
| Rank | Student | School | City | Province/State | Country |
|---|---|---|---|---|---|
| 1 | Brian Y. | Holy Cross Catholic Elementary School | Lasalle | Ontario | Canada |
| 2 | Vanya G. | Math Competition Coaching | Ashburn | Virginia | USA |
| 3 | Max L. | New Horizons School | Sherwood Park | Alberta | Canada |
| 4 | Zeyad A. | Marigold Elementary | Victoria | British Columbia | Canada |
| 5 | Luca P. | Holy Cross Catholic Elementary School | Lasalle | Ontario | Canada |
| 6 | Elliezon M. | Queen Of All Saints Elementary School | Coquitlam | British Columbia | Canada |
| 7 | Jeffrey L. | Collingwood School | West Vancouver | British Columbia | Canada |
| 8 | Reyaan P. | Math Competition Coaching | Ashburn | Virginia | USA |
| 9 | Moksh P. | New Horizons School | Sherwood Park | Alberta | Canada |
| 10 | Lewis C. | Aurora Prep Academy | Aurora | Ontario | Canada |
| 11 | Peter L. | Queen Of All Saints Elementary School | Coquitlam | British Columbia | Canada |
| 12 | Kaylee B. | Collingwood School | West Vancouver | British Columbia | Canada |
| 13 | Irene L. | Collingwood School | West Vancouver | British Columbia | Canada |
| 14 | Cole B. | Pineland P.S. | Burlington | Ontario | Canada |