Grade 2 National Score Analysis
Key percentile cutoffs and distribution overview for the April 2026 ICMC results.
Top 1%
≥ 83
Top 5%
≥ 77
Top 10%
≥ 68
Top 25%
≥ 45
Five-Number Summary
| Minimum | Q1 (25%) | Median | Q3 (75%) | Maximum |
|---|---|---|---|---|
| 0 | 21 | 30 | 45 | 94 |
Normalized Score Distribution
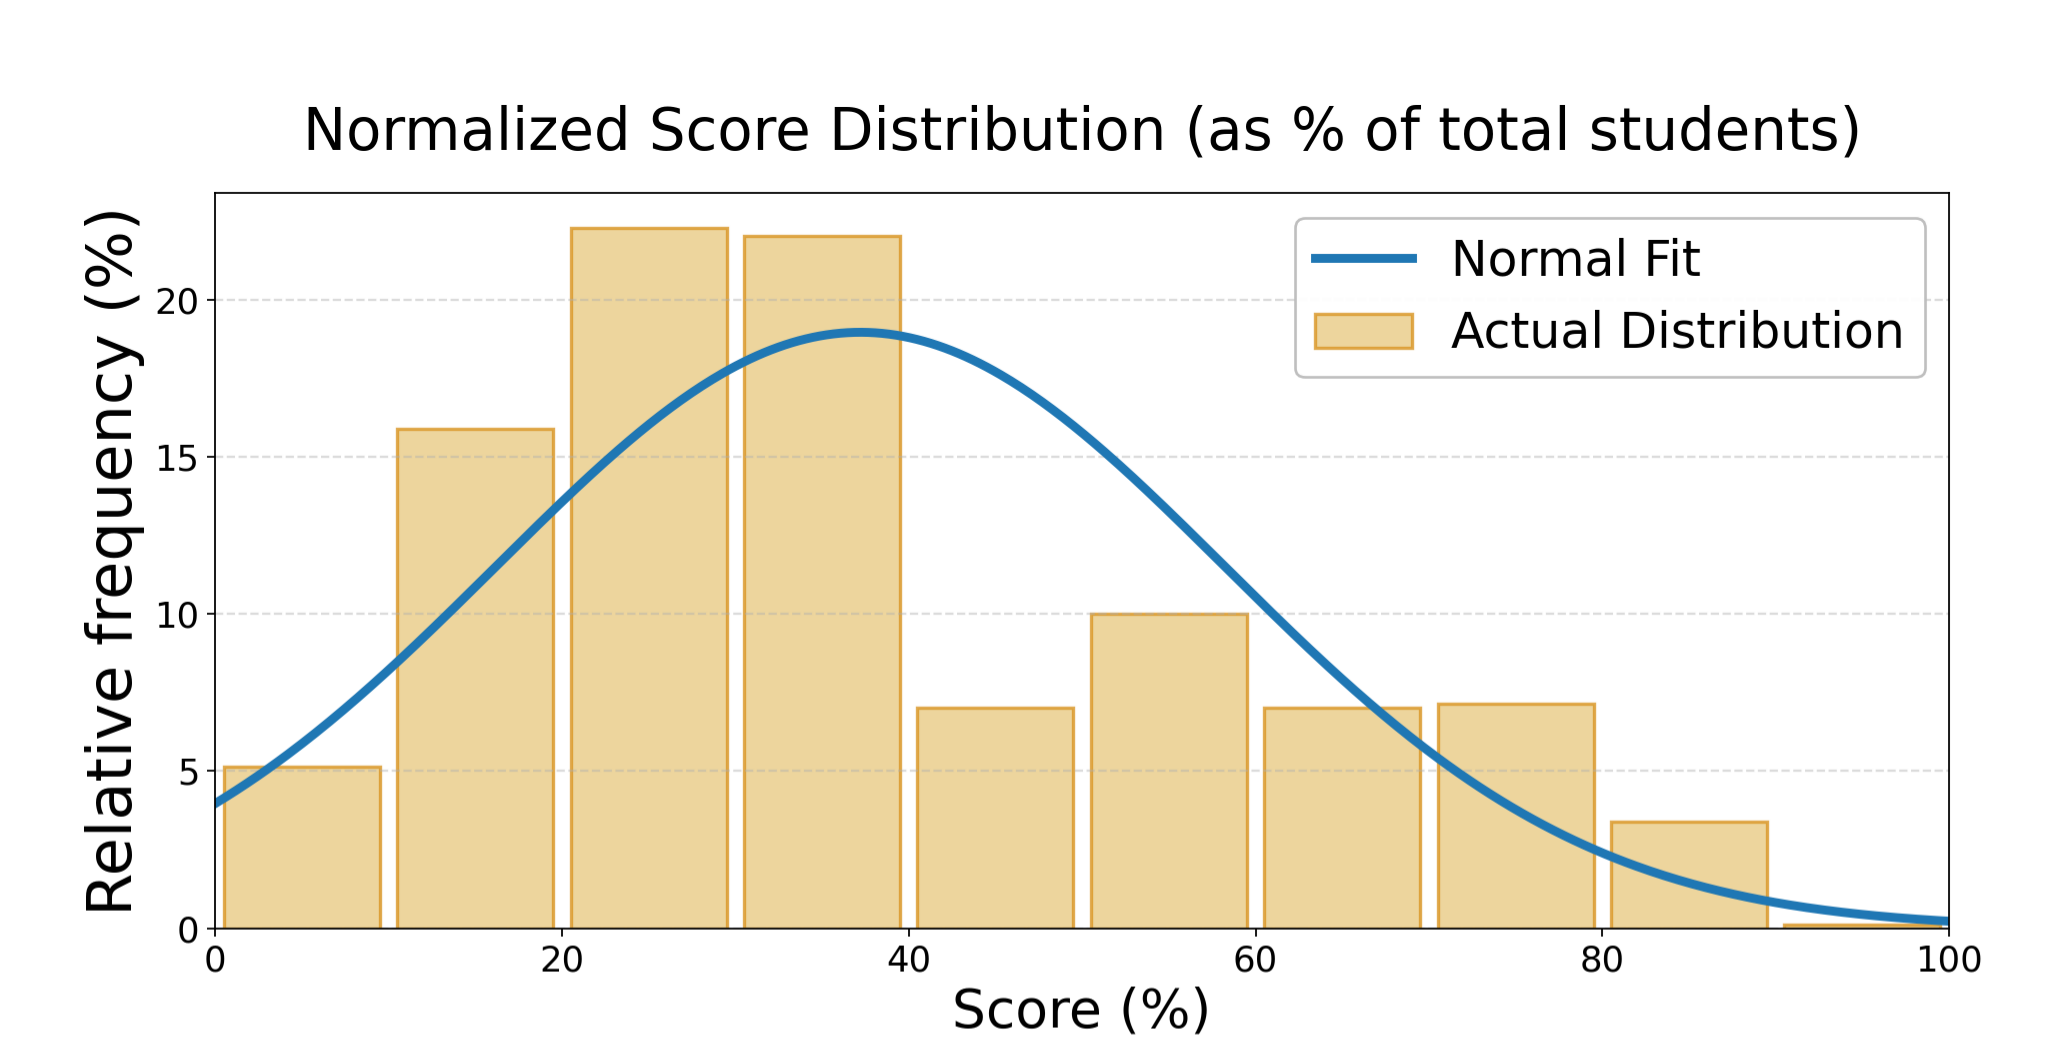
Bars show the proportion of students per score range; curve shows normal fit.
Grade 2 Top Math Stars
| Rank | Student | School | City | Province/State | Country |
|---|---|---|---|---|---|
| 1 | Selina L. | Stittsville Public School | Ottawa | Ontario | Canada |
| 2 | Nawab S. | Southwood Public School | Windsor | Ontario | Canada |
| 3 | Vaanya H. | NA | NA | NA | NA |
| 4 | Cormac T. | New Horizons School | Sherwood Park | Alberta | Canada |
| 5 | Brooklyn V. | New Horizons School | Sherwood Park | Alberta | Canada |
| 6 | Mia J. | Queen Of All Saints Elementary School | Coquitlam | British Columbia | Canada |
| 7 | Maya T. | Collingwood School | West Vancouver | British Columbia | Canada |
| 8 | Brooks L. | Bellewood Public School | Windsor | Ontario | Canada |
| 9 | Shado S. | Mulgrave School | West Vancouver | British Columbia | Canada |
| 10 | Selta S. | Mulgrave School | West Vancouver | British Columbia | Canada |