Grade 1 National Score Analysis
Key percentile cutoffs and distribution overview for the November 2025 ICMC results.
Top 1%
≥ 75
Top 5%
≥ 60
Top 10%
≥ 55
Top 25%
≥ 45
Five-Number Summary
| Minimum | Q1 (25%) | Median | Q3 (75%) | Maximum |
|---|---|---|---|---|
| 0 | 20 | 35 | 45 | 90 |
Normalized Score Distribution
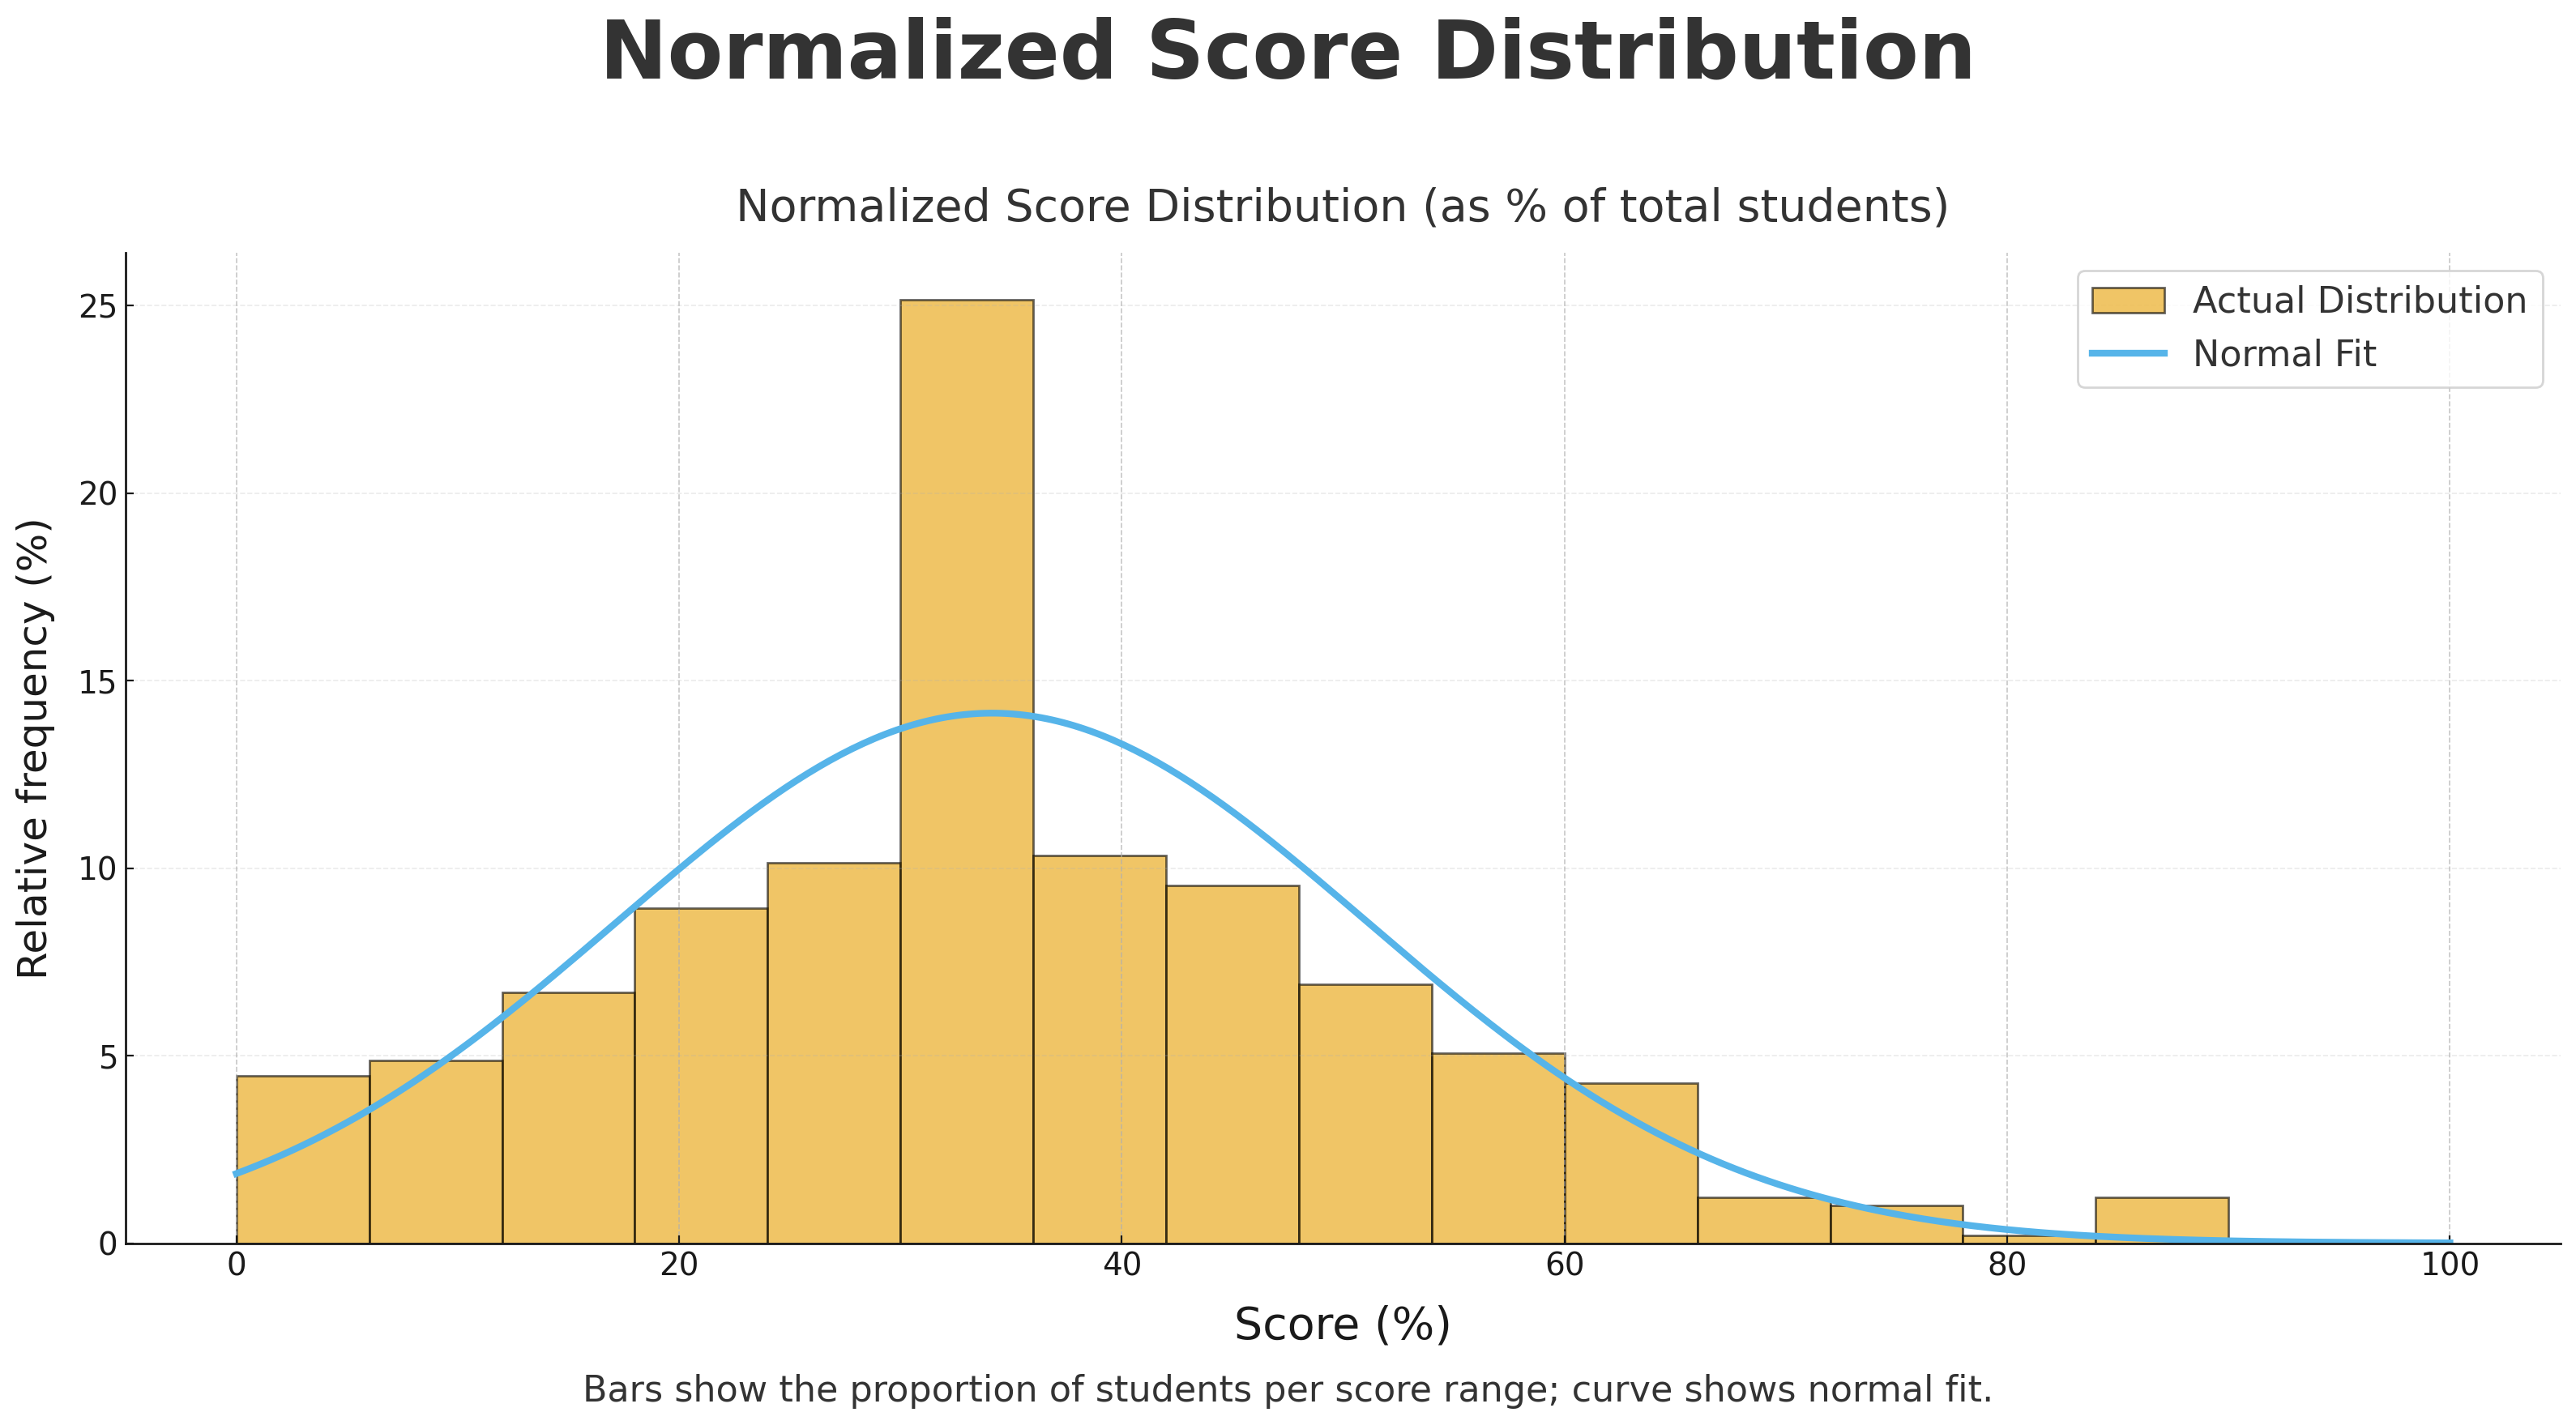
Bars show the proportion of students per score range; curve shows normal fit.
Grade 1 Top 10 Math Stars
| Rank | Student | School | City | Province/State | Country |
|---|---|---|---|---|---|
| 1 | Evan V. | Pineland P.S. | Burlington | Ontario | Canada |
| 2 | Sidney A. | New Horizons School | Sherwood Park | Alberta | Canada |
| 3 | Yasmeen T. | Pineland P.S. | Burlington | Ontario | Canada |
| 4 | Hunter | Halton Hills Christian School | Georgetown | Ontario | Canada |
| 5 | Justin | Halton Hills Christian School | Georgetown | Ontario | Canada |
| 6 | Silas | Halton Hills Christian School | Georgetown | Ontario | Canada |
| 7 | Nathan Z. | Holy Spirit Catholic Elementary School | Aurora | Ontario | Canada |
| 8 | Advait P. | New Horizons School | Sherwood Park | Alberta | Canada |
| 9 | Caleb M. | Leo Baeck Day School | Toronto | Ontario | Canada |
| 10 | Samuel S. | Collingwood School | West Vancouver | British Columbia | Canada |