Grade 4 National Score Analysis
Key percentile cutoffs and distribution overview for the May 2026 ICMC results.
Top 1%
≥ 86
Top 5%
≥ 76
Top 10%
≥ 70
Top 25%
≥ 58
Five-Number Summary
| Minimum | Q1 (25%) | Median | Q3 (75%) | Maximum |
|---|---|---|---|---|
| 0 | 28 | 41 | 58 | 100 |
Normalized Score Distribution
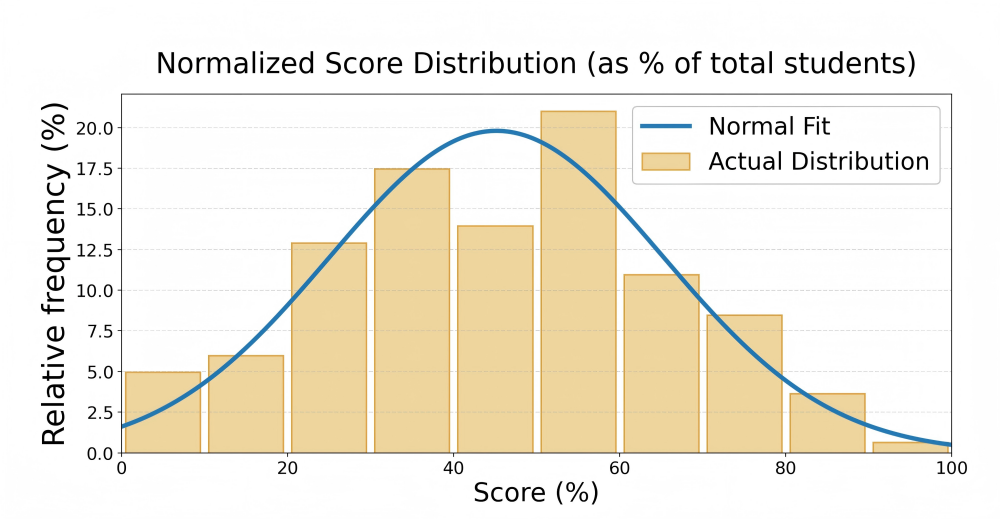
Bars show the proportion of students per score range; curve shows normal fit.
Grade 4 Top Math Stars
| Rank | Student | School | City | Province/State | Country |
|---|---|---|---|---|---|
| 1 | Nainika G. | Math Competition Coaching | Ashburn | Virginia | USA |
| 2 | Sopta S. | Mulgrave School | West Vancouver | British Columbia | Canada |
| 3 | Kai J. | Collingwood School | West Vancouver | British Columbia | Canada |
| 4 | Reeya K. | Collingwood School | West Vancouver | British Columbia | Canada |
| 5 | Sukayna A. | Safa And Marwa | Mississauga | Ontario | Canada |
| 6 | Kristen S. | Sandwich West Public School | Lasalle | Ontario | Canada |
| 7 | Leenah K. | Sandwich West Public School | Lasalle | Ontario | Canada |
| 8 | Shanaya G. | Math Competition Coaching | Ashburn | Virginia | USA |
| 9 | Joshua T. | Queen Of All Saints Elementary School | Coquitlam | British Columbia | Canada |
| 10 | Michael W. | Queen Of All Saints Elementary School | Coquitlam | British Columbia | Canada |