Grade 6 National Score Analysis
Key percentile cutoffs and distribution overview for the February 2026 ICMC results.
Top 1%
≥ 88
Top 5%
≥ 76
Top 10%
≥ 68
Top 25%
≥ 50
Five-Number Summary
| Minimum | Q1 (25%) | Median | Q3 (75%) | Maximum |
|---|---|---|---|---|
| 0 | 21 | 35 | 50 | 100 |
Normalized Score Distribution
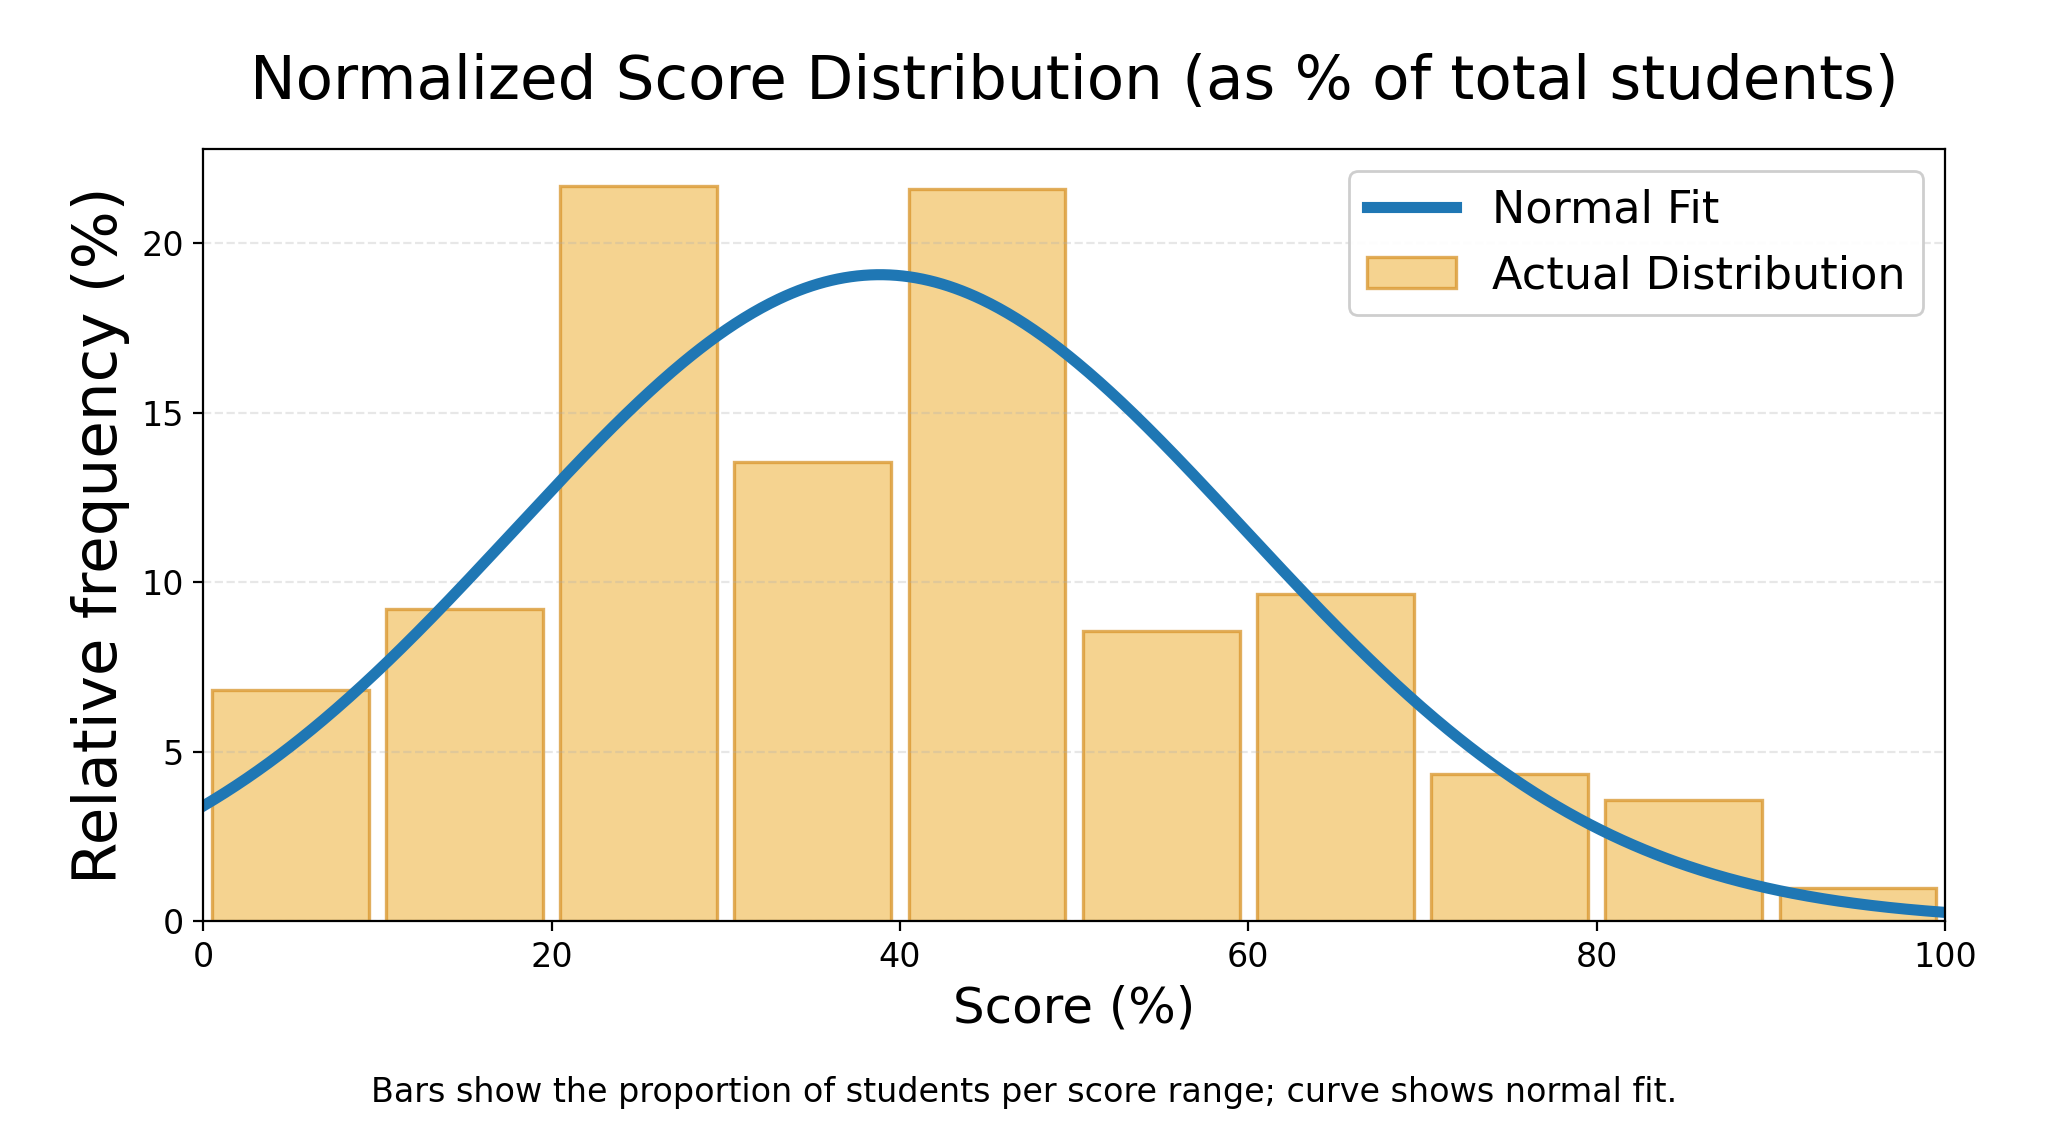
Bars show the proportion of students per score range; curve shows normal fit.
Grade 6 Top Math Stars
| Rank | Student | School | City | Province/State | Country |
|---|---|---|---|---|---|
| 1 | Maxim Z. | Fred C. Cook | Bradford | Ontario | Canada |
| 2 | Henry W. | Collingwood School | West Vancouver | British Columbia | Canada |
| 3 | Jake H. | Halton Hills Christian School | Georgetown | Ontario | Canada |
| 4 | Darsh D. | Math Competition Coaching | Ashburn | Virginia | USA |
| 5 | Andy L. | Collingwood School | West Vancouver | British Columbia | Canada |
| 6 | Annabelle T. | Collingwood School | West Vancouver | British Columbia | Canada |
| 7 | Simon Y. | Collingwood School | West Vancouver | British Columbia | Canada |
| 8 | Andrii S. | Math Competition Coaching | Ashburn | Virginia | USA |
| 9 | Benjamin T. | George Street Middle School | Fredericton | New Brunswick | Canada |
| 10 | Gabriel W. | Queen Of All Saints Elementary School | Coquitlam | British Columbia | Canada |
| 11 | Adam M. | Allan A. Martin Sr. Public School | Mississauga | Ontario | Canada |