Grade 5 National Score Analysis
Key percentile cutoffs and distribution overview for the February 2026 ICMC results.
Top 1%
≥ 80
Top 5%
≥ 68
Top 10%
≥ 60
Top 25%
≥ 48
Five-Number Summary
| Minimum | Q1 (25%) | Median | Q3 (75%) | Maximum |
|---|---|---|---|---|
| 0 | 23 | 35 | 48 | 96 |
Normalized Score Distribution
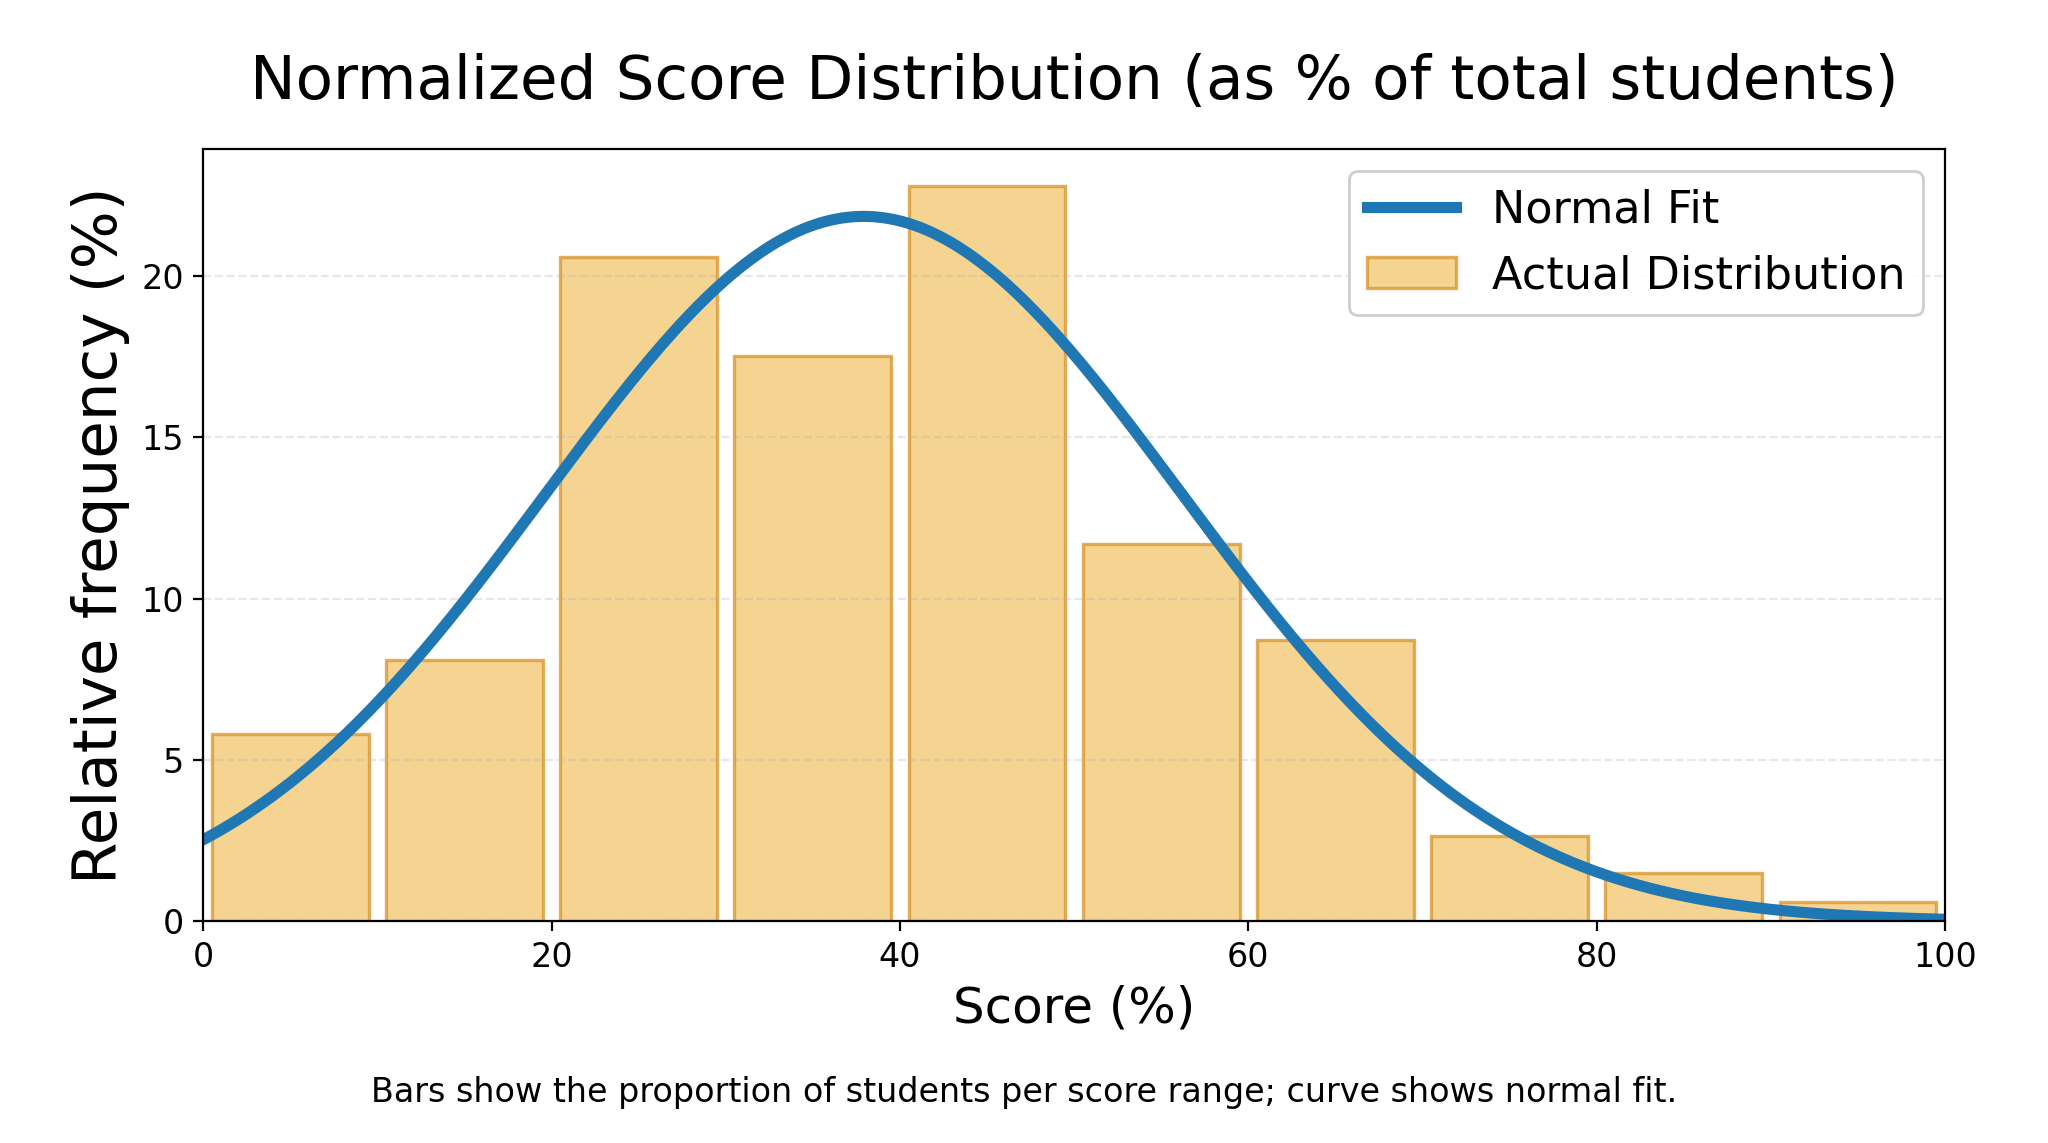
Bars show the proportion of students per score range; curve shows normal fit.
Grade 5 Top Math Stars
| Rank | Student | School | City | Province/State | Country |
|---|---|---|---|---|---|
| 1 | Darren Z. | Collingwood School | West Vancouver | British Columbia | Canada |
| 2 | Landon T. | Aberdeen Hall | Kelowna | British Columbia | Canada |
| 3 | Ervin Y. | White Rock Christian Academy | Surrey | British Columbia | Canada |
| 4 | Rihon M. | Math Competition Coaching | Ashburn | Virginia | USA |
| 5 | George K. | Stella Maris Catholic Elementary School | Amherstburg | Ontario | Canada |
| 6 | Jenny L. | Académie Ste-Cécile International School | Windsor | Ontario | Canada |
| 7 | Jayden W. | Aberdeen Hall | Kelowna | British Columbia | Canada |
| 8 | Rich L. | St. John Vianney | Windsor | Ontario | Canada |
| 9 | Alexander D. | Halton Hills Christian School | Georgetown | Ontario | Canada |
| 10 | Perley S. | Pineland Public School | Burlington | Ontario | Canada |