Grade 5 National Score Analysis
Key percentile cutoffs and distribution overview for the November 2025 ICMC results.
Top 1%
≥ 70
Top 5%
≥ 58
Top 10%
≥ 54
Top 25%
≥ 45
Five-Number Summary
| Minimum | Q1 (25%) | Median | Q3 (75%) | Maximum |
|---|---|---|---|---|
| 0 | 20 | 36 | 45 | 83 |
Normalized Score Distribution
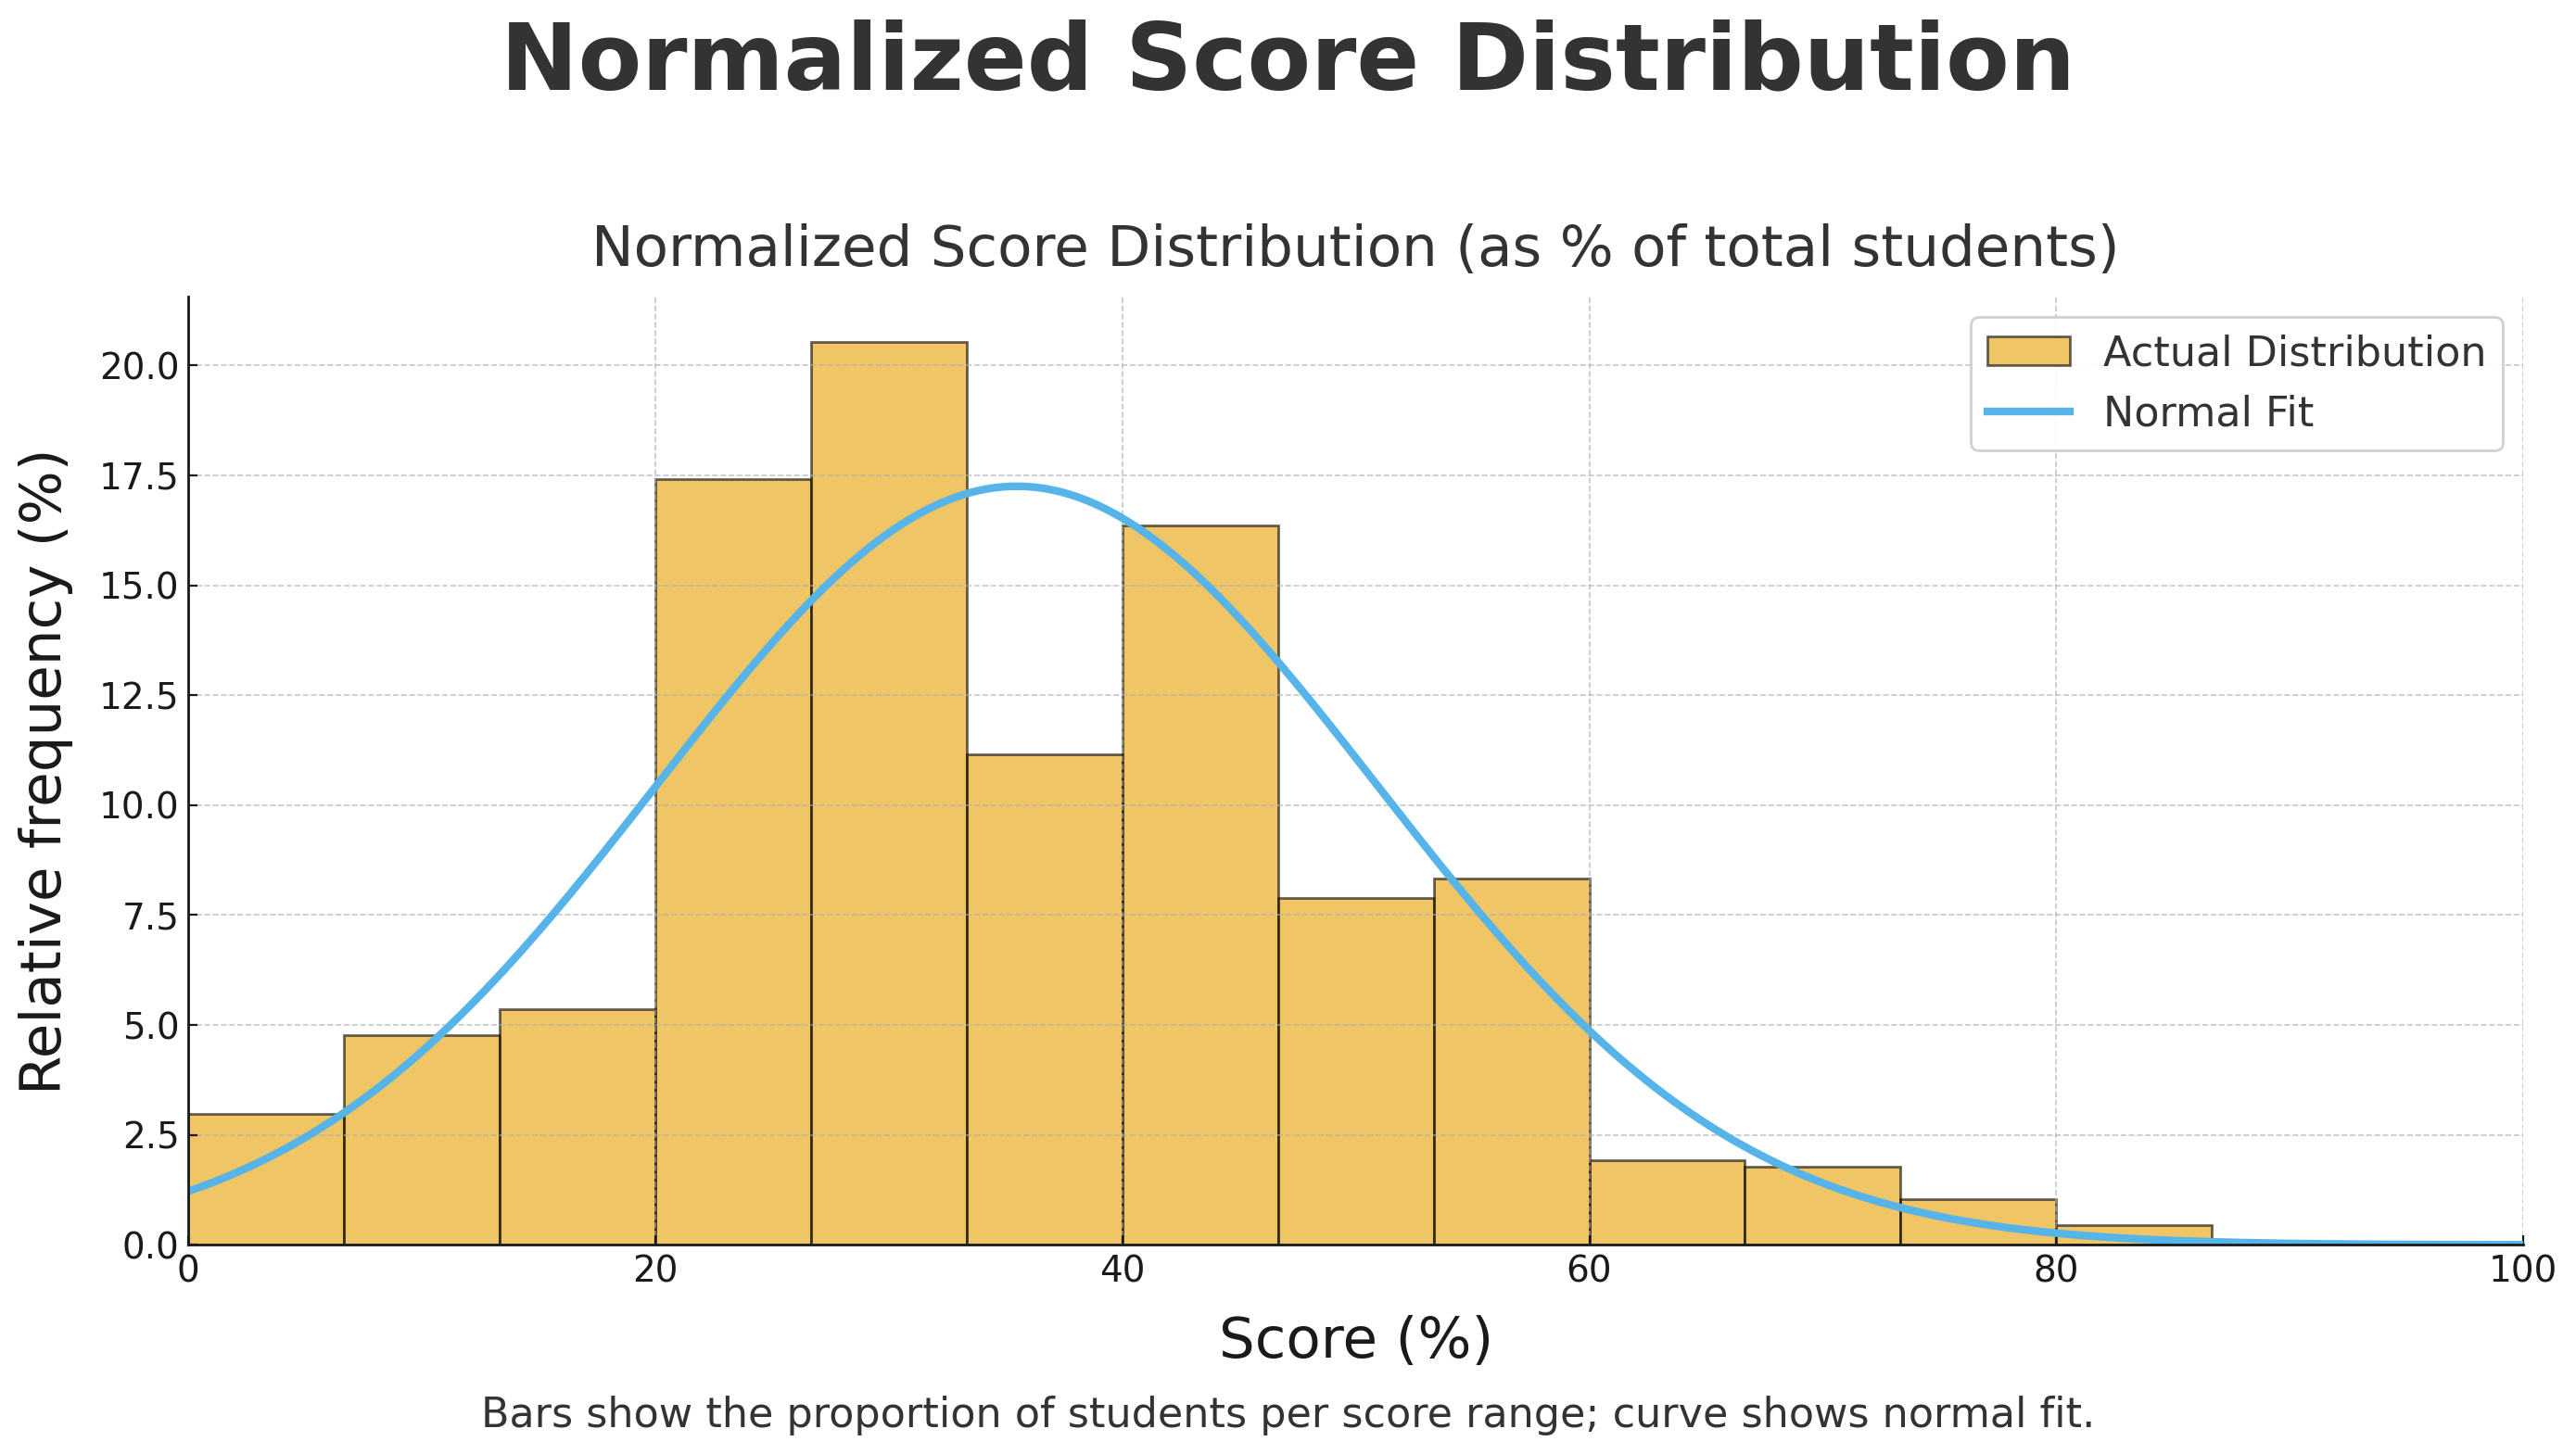
Bars show the proportion of students per score range; curve shows normal fit.
Grade 5 Top 10 Math Stars
| Rank | Student | School | City | Province/State | Country |
|---|---|---|---|---|---|
| 1 | Rich L. | St. John Vianney | Windsor | Ontario | Canada |
| 2 | George K. | Stella Maris Catholic Elementary School | Amherstburg | Ontario | Canada |
| 3 | Darren Z. | Collingwood School | West Vancouver | British Columbia | Canada |
| 4 | James V. | Southwood | Windsor | Ontario | Canada |
| 5 | Sun K. | Collingwood School | West Vancouver | British Columbia | Canada |
| 8 | Cristina N. | Holy Cross Catholic Elementary School | Lasalle | Ontario | Canada |
| 6 | Noah P. | Collingwood School | West Vancouver | British Columbia | Canada |
| 9 | Jenny L. | Académie Ste-Cécile International School | Windsor | Ontario | Canada |
| 7 | Dimo Y. | Collingwood School | West Vancouver | British Columbia | Canada |
| 10 | Haoming L. | Collingwood School | West Vancouver | British Columbia | Canada |