Grade 3 National Score Analysis
Key percentile cutoffs and distribution overview for the November 2025 ICMC results.
Top 1%
≥ 82
Top 5%
≥ 65
Top 10%
≥ 60
Top 25%
≥ 47
Five-Number Summary
| Minimum | Q1 (25%) | Median | Q3 (75%) | Maximum |
|---|---|---|---|---|
| 0 | 26 | 35 | 47 | 96 |
Normalized Score Distribution
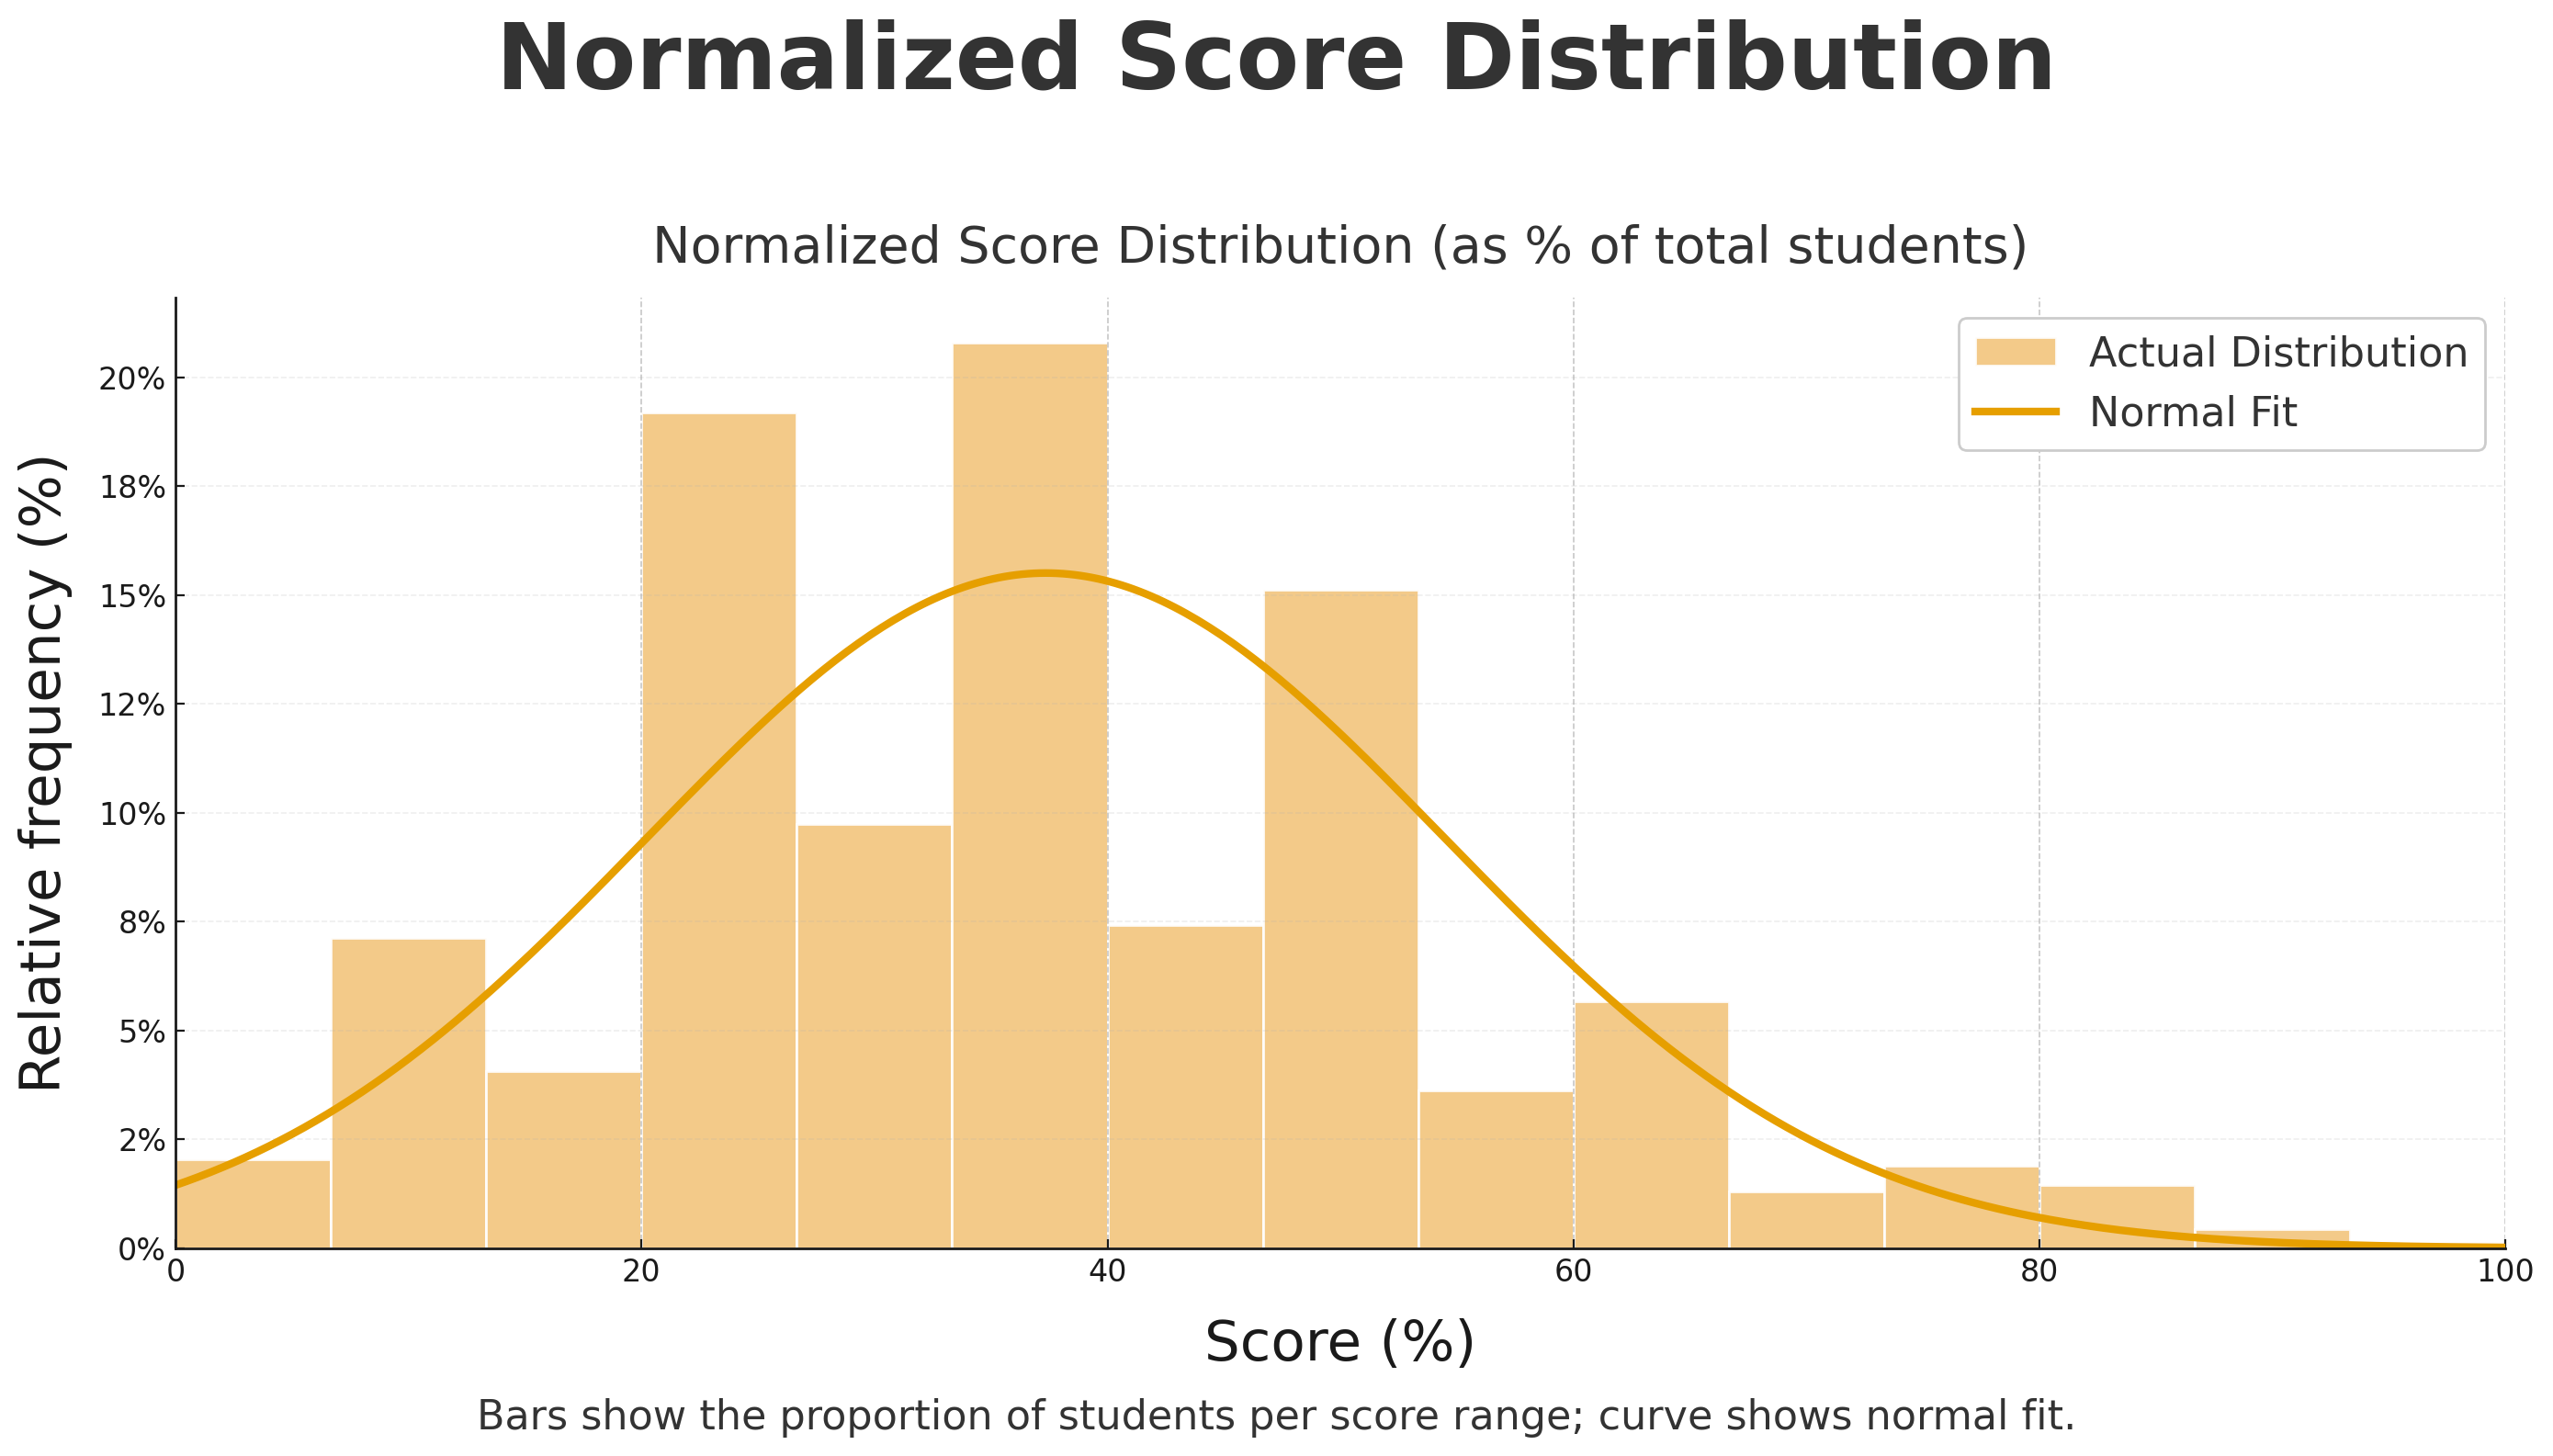
Bars show the proportion of students per score range; curve shows normal fit.
Grade 3 Top 10 Math Stars
| Rank | Student | School | City | Province/State | Country |
|---|---|---|---|---|---|
| 1 | Max L. | New Horizons School | Sherwood Park | Alberta | Canada |
| 2 | Brian Y. | Holy Cross Catholic Elementary School | Lasalle | Ontario | Canada |
| 3 | Patricia N. | Holy Cross Catholic Elementary School | Lasalle | Ontario | Canada |
| 4 | Irene L. | Collingwood School | West Vancouver | British Columbia | Canada |
| 5 | Yash Y. | New Horizons School | Sherwood Park | Alberta | Canada |
| 6 | Aiden R. | Red Willow Public School | Brampton | Ontario | Canada |
| 7 | Kai M. | New Horizons School | Sherwood Park | Alberta | Canada |
| 8 | Sana S. | New Horizons School | Sherwood Park | Alberta | Canada |
| 9 | Sophia T. | Centennial (Cambridge) Public School | Cambridge | Ontario | Canada |
| 10 | Derek V. | New Horizons School | Sherwood Park | Alberta | Canada |