Grade 2 National Score Analysis
Key percentile cutoffs and distribution overview for the November 2025 ICMC results.
Top 1%
≥ 65
Top 5%
≥ 55
Top 10%
≥ 50
Top 25%
≥ 40
Five-Number Summary
| Minimum | Q1 (25%) | Median | Q3 (75%) | Maximum |
|---|---|---|---|---|
| 0 | 20 | 30 | 40 | 90 |
Normalized Score Distribution
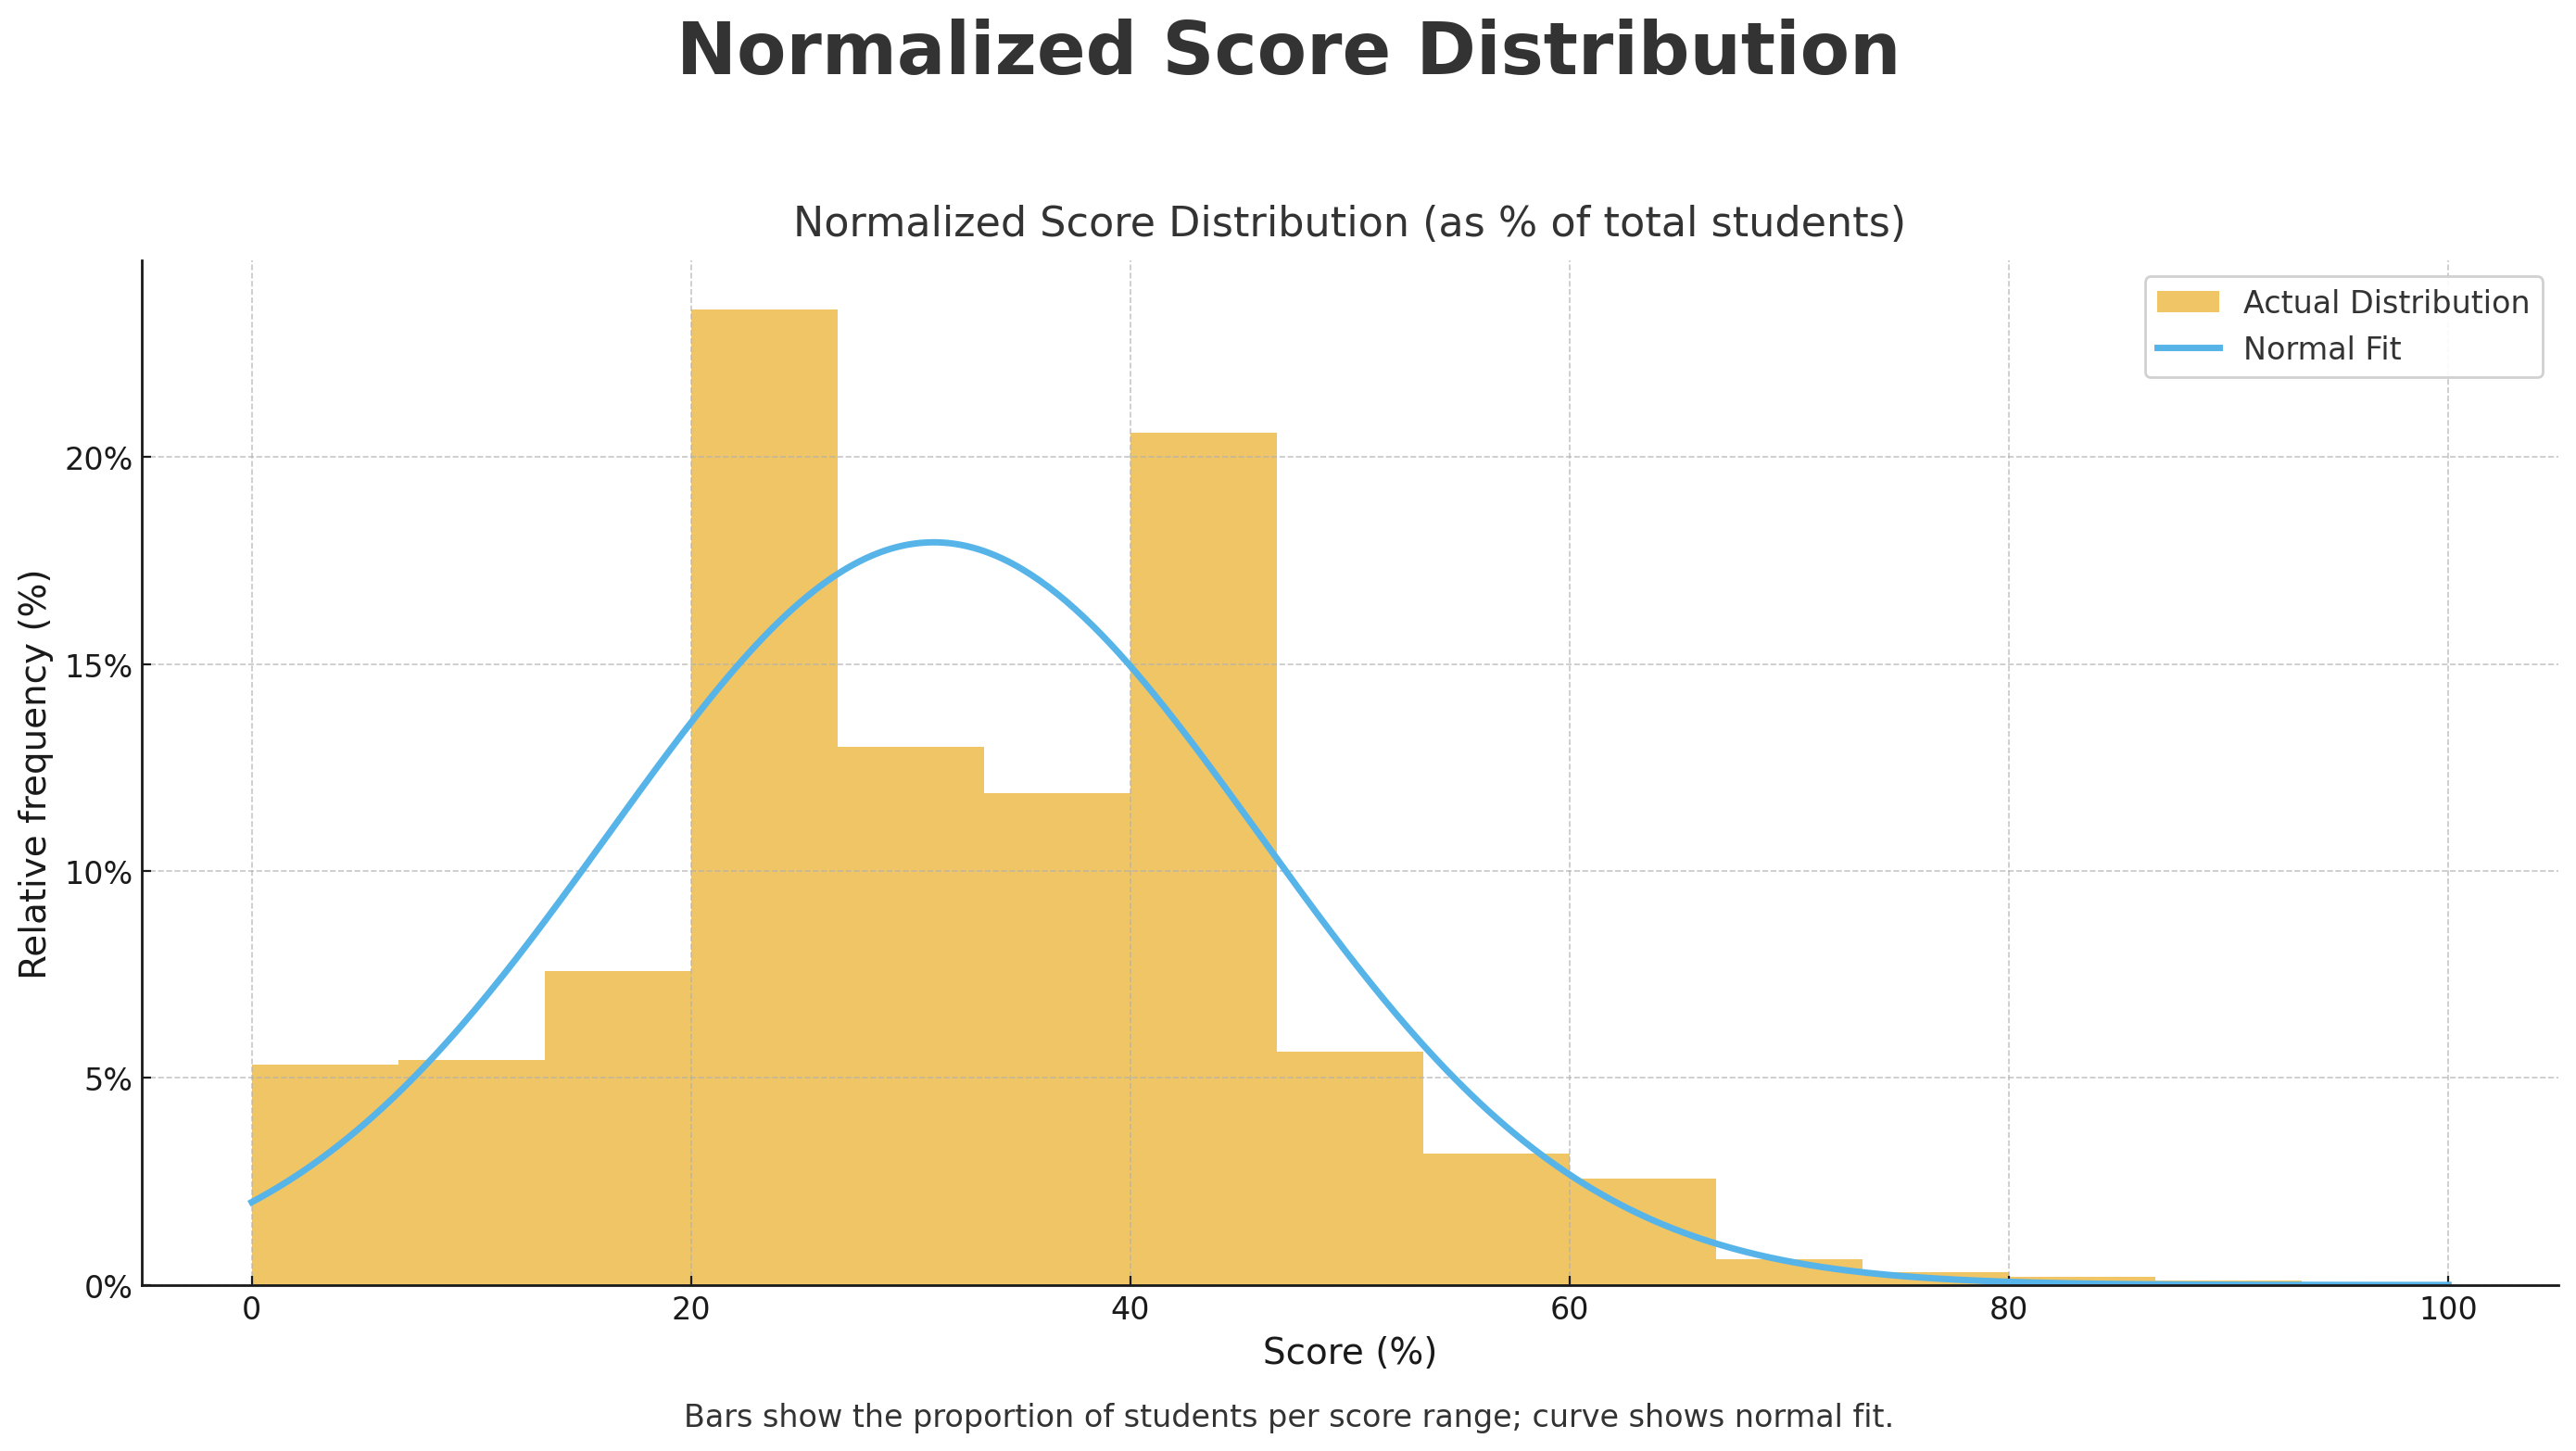
Bars show the proportion of students per score range; curve shows normal fit.
Grade 2 Top 10 Math Stars
| Rank | Student | School | City | Province/State | Country |
|---|---|---|---|---|---|
| 1 | Prabhav B. | Math Competition Coaching | Ashburn | Virginia | USA |
| 2 | Raymond W. | Mount Pleasant school | Edmonton | Alberta | Canada |
| 3 | William C. | Byron Northview Public School | London | Ontario | Canada |
| 4 | Caleb M. | Leo Baeck Day School | Toronto | Ontario | Canada |
| 5 | Tristin K. | Sandwich West Public School | Lasalle | Ontario | Canada |
| 6 | Nolan Y. | Collingwood School | West Vancouver | British Columbia | Canada |
| 7 | Selina L. | Stittsville Public School | Ottawa | Ontario | Canada |
| 8 | Eric L. | Académie Ste-Cécile International School | Windsor | Ontario | Canada |
| 9 | Mariam S. | Safa And Marwa | Mississauga | Ontario | Canada |
| 10 | Sophia R. | River View Public School | Niagara Falls | Ontario | Canada |