Grade 5 National Score Analysis
Key percentile cutoffs and distribution overview for the October 2025 ICMC results.
Top 1%
≥ 76
Top 5%
≥ 64
Top 10%
≥ 56
Top 25%
≥ 48
Five-Number Summary
| Minimum | Q1 (25%) | Median | Q3 (75%) | Maximum |
|---|---|---|---|---|
| 0 | 28 | 36 | 48 | 92 |
Normalized Score Distribution
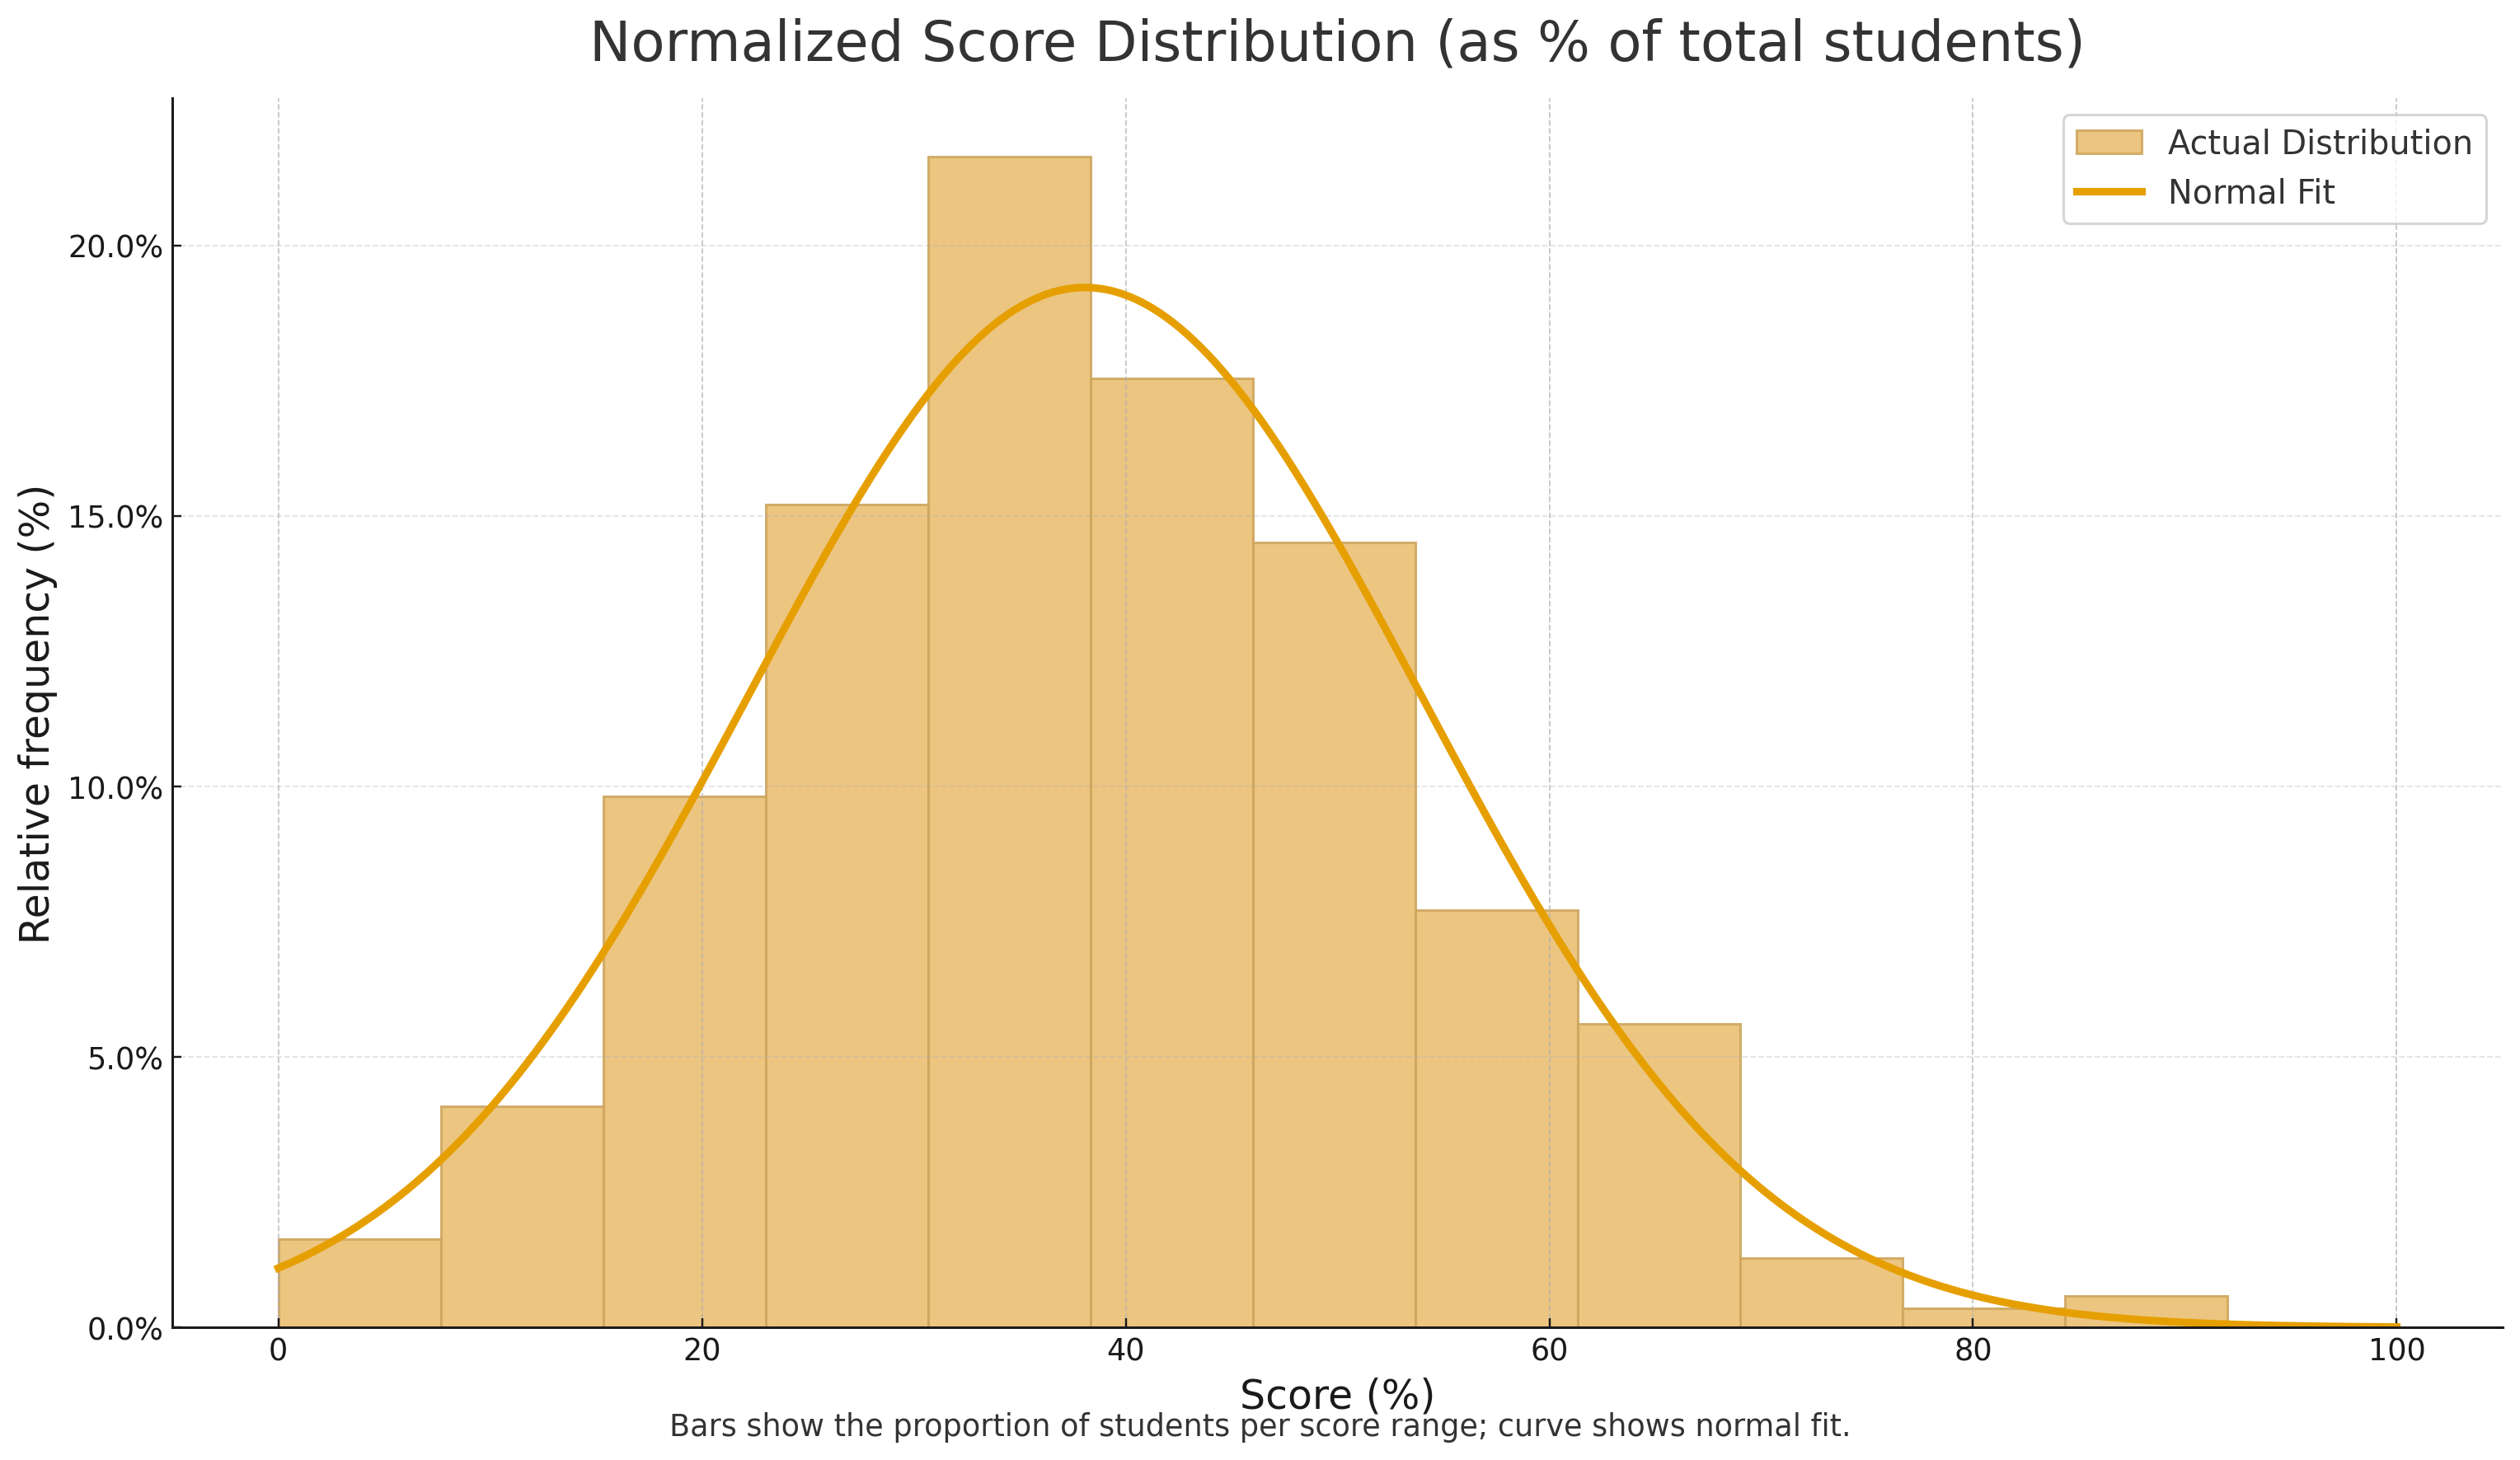
Bars show the proportion of students per score range; curve shows normal fit.
Grade 5 Top 10 Math Stars
| Rank | Student | School | City | Province/State | Country |
|---|---|---|---|---|---|
| 1 | Rich L. | St. John Vianney Catholic School | Windsor | Ontario | Canada |
| 2 | Olivia C. | Brookmede Public School | Toronto | Ontario | Canada |
| 3 | Thomas K. | Math Competition Coaching | Ashburn | Virginia | USA |
| 4 | Emma P. | Heritage Park Public School | Scarborough | Ontario | Canada |
| 5 | George K. | Stella Maris Catholic Elementary School | Amherstburg | Ontario | Canada |
| 6 | Siddhartha G. | Math Competition Coaching | Ashburn | Virginia | USA |
| 7 | Stephanie J. | Sandwich West Public School | Lasalle | Ontario | Canada |
| 8 | Shanaya S. | Math Competition Coaching | Ashburn | Virginia | USA |
| 9 | Rae Y. | Sandwich West Public School | Lasalle | Ontario | Canada |
| 10 | Marko L. | New Horizons School | Sherwood Park | Alberta | Canada |