Grade 4 National Score Analysis
Key percentile cutoffs and distribution overview for the October 2025 ICMC results.
Top 1%
≥ 70
Top 5%
≥ 62
Top 10%
≥ 54
Top 25%
≥ 45
Five-Number Summary
| Minimum | Q1 (25%) | Median | Q3 (75%) | Maximum |
|---|---|---|---|---|
| 0 | 25 | 37 | 45 | 100 |
Normalized Score Distribution
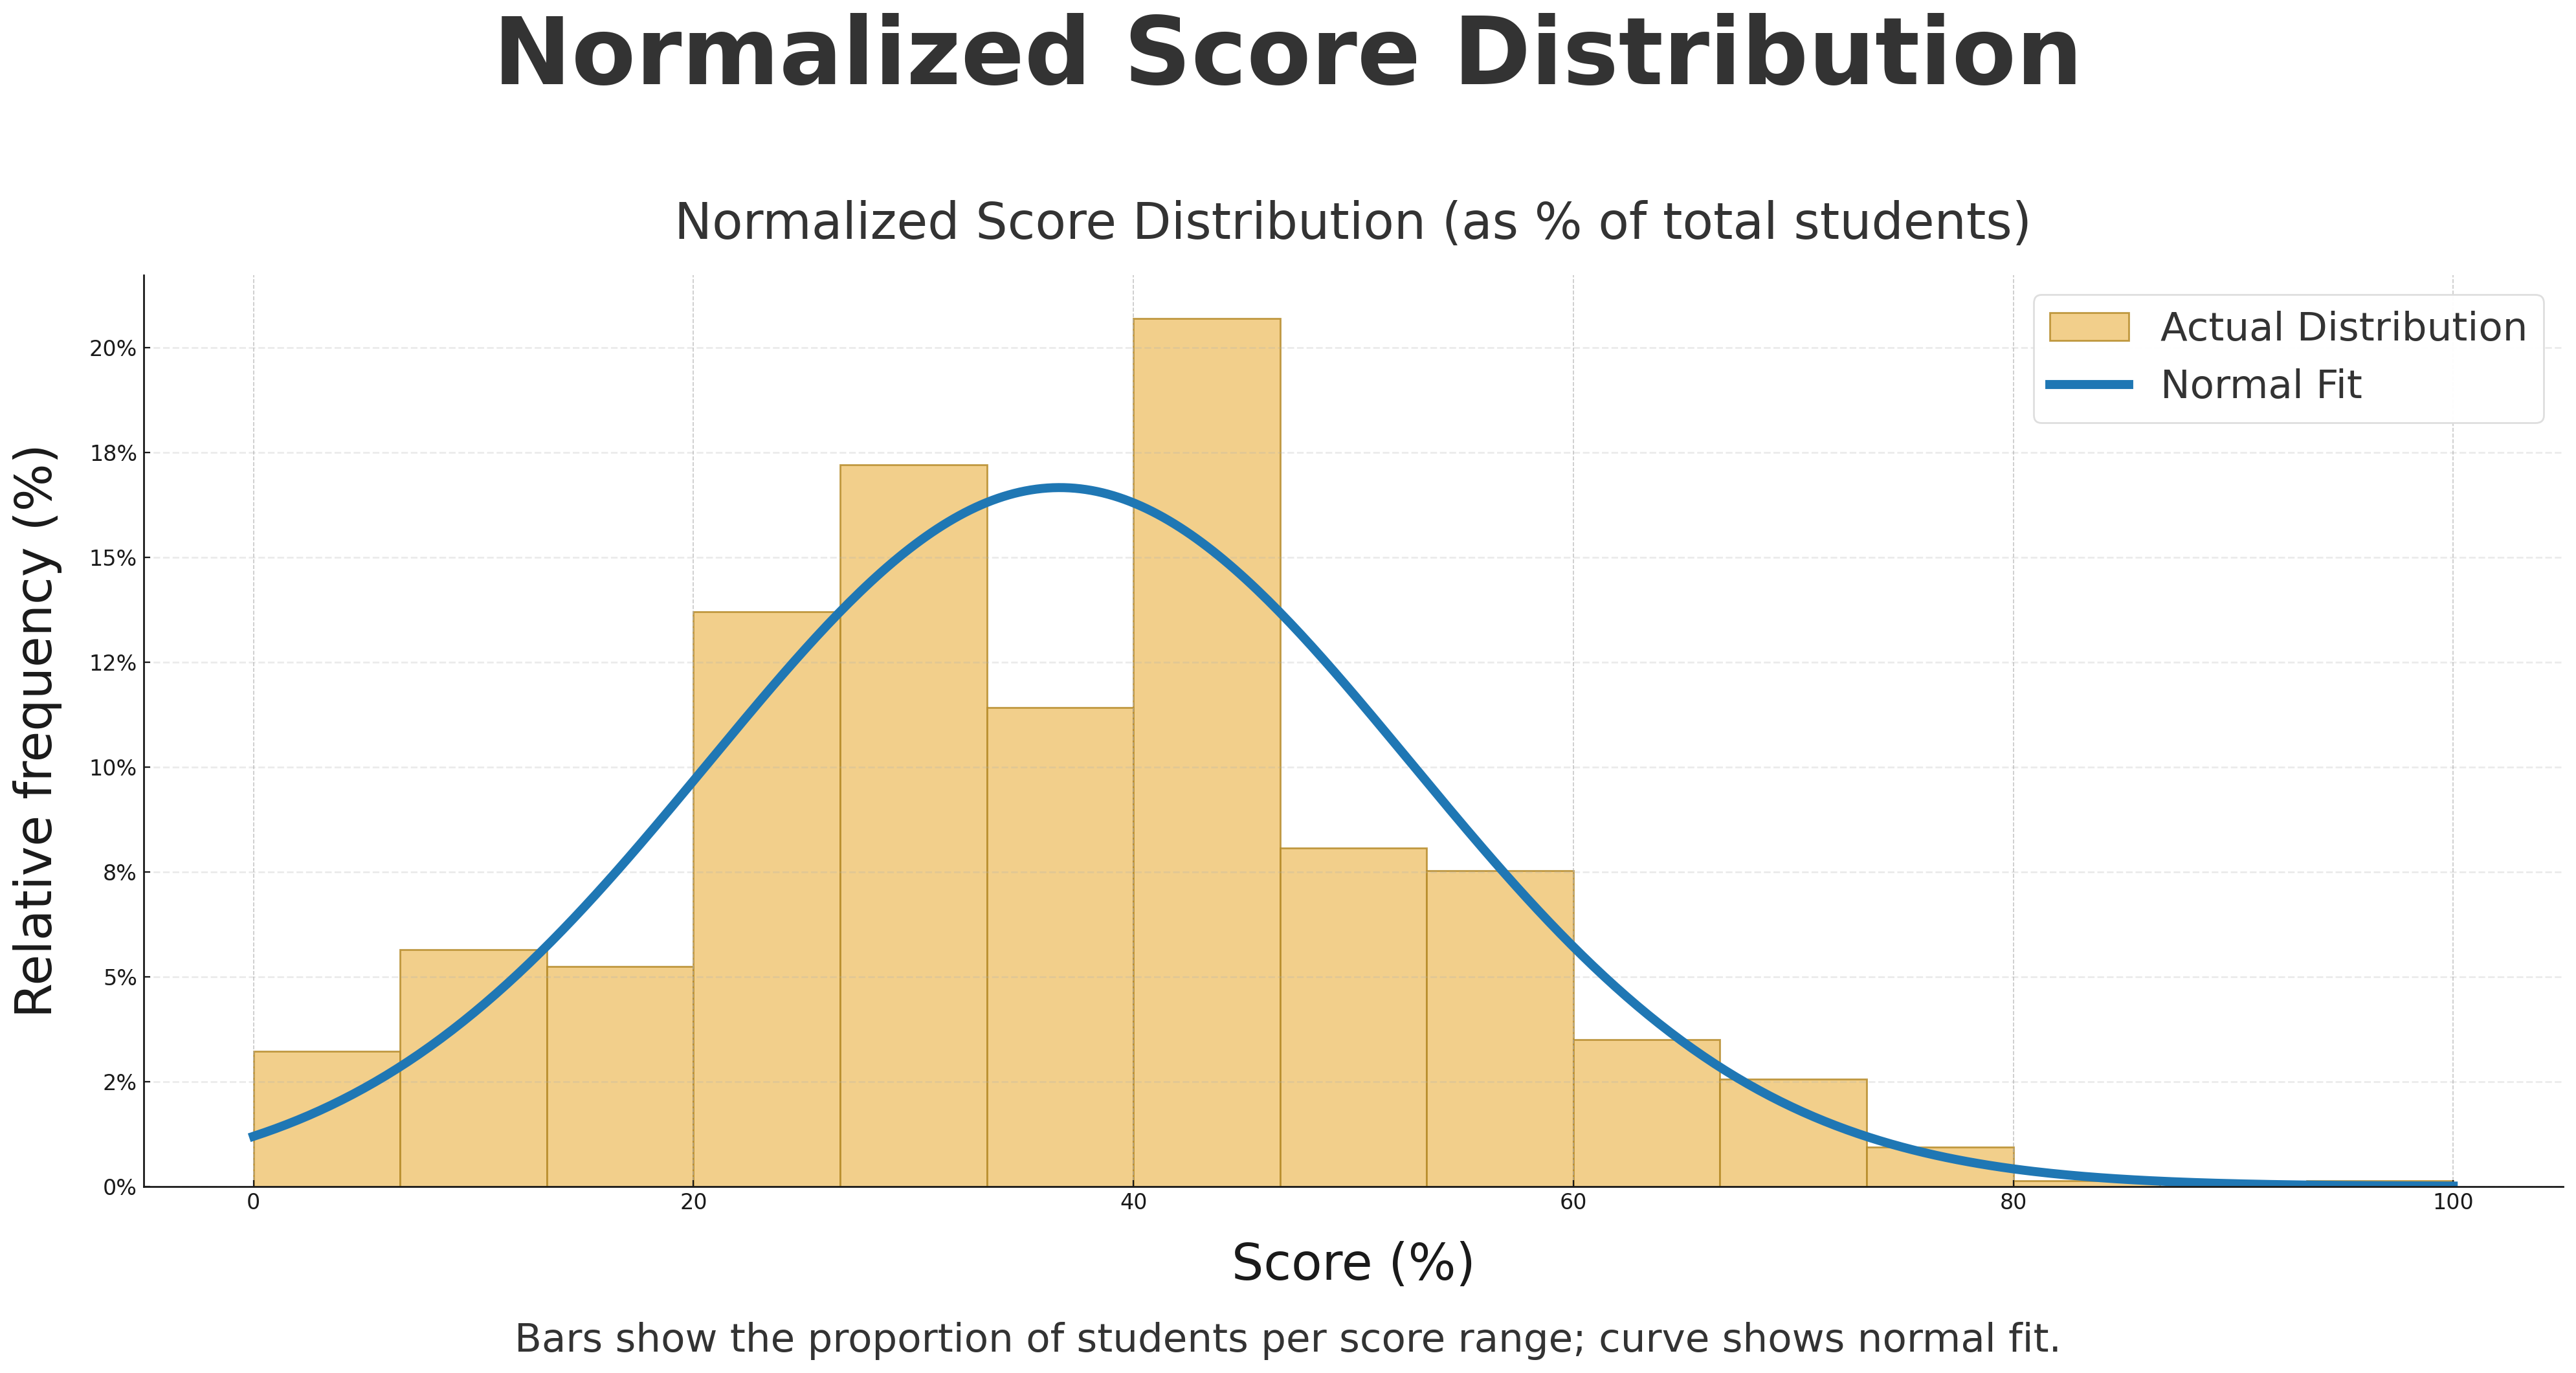
Bars show the proportion of students per score range; curve shows normal fit.
Grade 4 Top 10 Math Stars
| Rank | Student | School | City | Province/State | Country |
|---|---|---|---|---|---|
| 1 | Nainika G. | Math Competition Coaching | Ashburn | Virginia | USA |
| 2 | Mason B. | New Horizons School | Sherwood Park | Alberta | Canada |
| 3 | Pallav Z. | Math Competition Coaching | Ashburn | Virginia | USA |
| 4 | Kristen S. | Sandwich West Public School | Lasalle | Ontario | Canada |
| 5 | Leenah K. | Sandwich West Public School | Lasalle | Ontario | Canada |
| 6 | Laasya M. | Math Competition Coaching | Ashburn | Virginia | USA |
| 7 | Emma C. | Bayview Public School | Toronto | Ontario | Canada |
| 8 | Jacob L. | Mountsfield Public School | London | Ontario | Canada |
| 9 | Ava P. | George Jay Elementary School | Victoria | British Columbia | Canada |
| 10 | Krishna A. | Southwood Public School | Windsor | Ontario | Canada |