Grade 2 National Score Analysis
Key percentile cutoffs and distribution overview for the October 2025 ICMC results.
Top 1%
≥ 75
Top 5%
≥ 65
Top 10%
≥ 55
Top 25%
≥ 50
Five-Number Summary
| Minimum | Q1 (25%) | Median | Q3 (75%) | Maximum |
|---|---|---|---|---|
| 0 | 30 | 40 | 50 | 85 |
Normalized Score Distribution
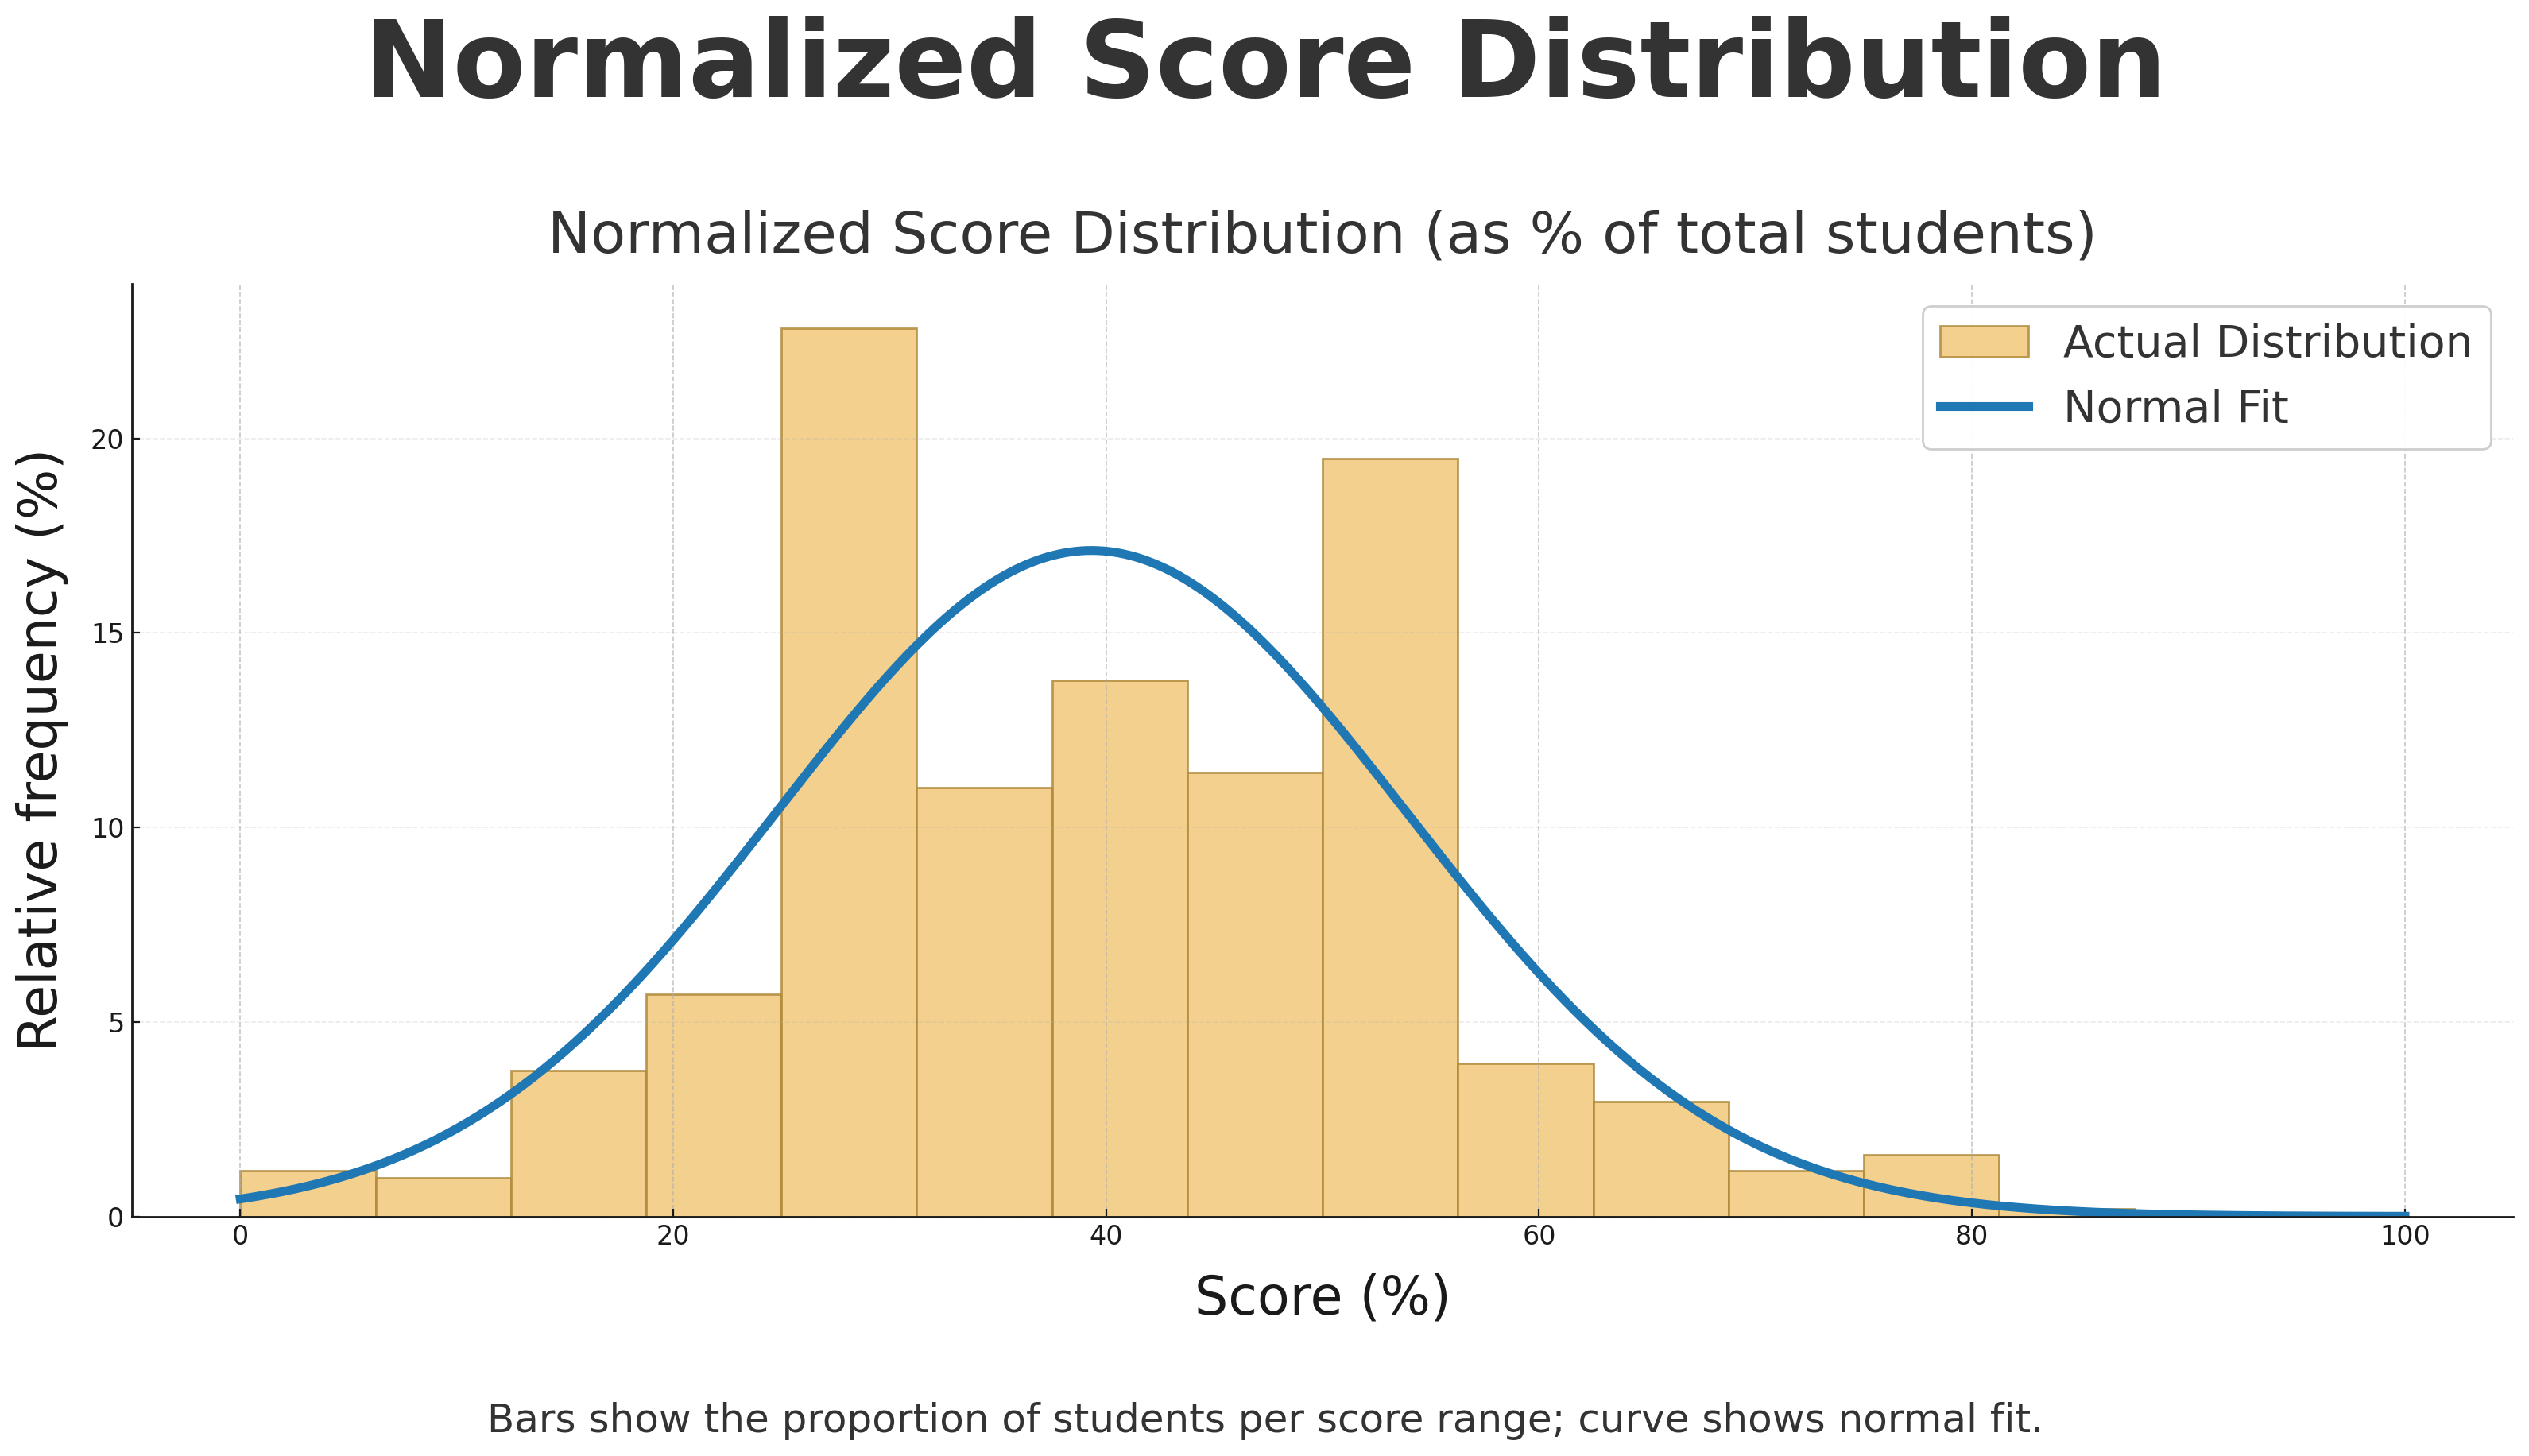
Bars show the proportion of students per score range; curve shows normal fit.
Grade 2 Top 10 Math Stars
| Rank | Student | School | City | Province/State | Country |
|---|---|---|---|---|---|
| 1 | Emily P. | Harrison Public School | Toronto | Ontario | Canada |
| 2 | Brooks L. | Bellewood Public School | Windsor | Ontario | Canada |
| 3 | Raymond W. | Mount Pleasant School | Edmonton | Alberta | Canada |
| 4 | Prabhav B. | Math Competition Coaching | Ashburn | Virginia | USA |
| 5 | Sophia K. | Broadview Public School | Ottawa | Ontario | Canada |
| 6 | Liam C. | Forest Grove Elementary School | Burnaby | British Columbia | Canada |
| 7 | Nawab S. | Southwood Public School | Windsor | Ontario | Canada |
| 8 | Olivia H. | East Side Alternative School | Vancouver | British Columbia | Canada |
| 9 | Andre Y. | Holy Cross Catholic Elementary School | Lasalle | Ontario | Canada |
| 10 | Isabella F. | Maple Grove Public School | Calgary | Alberta | Canada |