Grade 3 National Score Analysis
Key percentile cutoffs and distribution overview for the October 2025 ICMC results.
Top 1%
≥ 73
Top 5%
≥ 60
Top 10%
≥ 56
Top 25%
≥ 47
Five-Number Summary
| Minimum | Q1 (25%) | Median | Q3 (75%) | Maximum |
|---|---|---|---|---|
| 0 | 26 | 35 | 47 | 92 |
Normalized Score Distribution
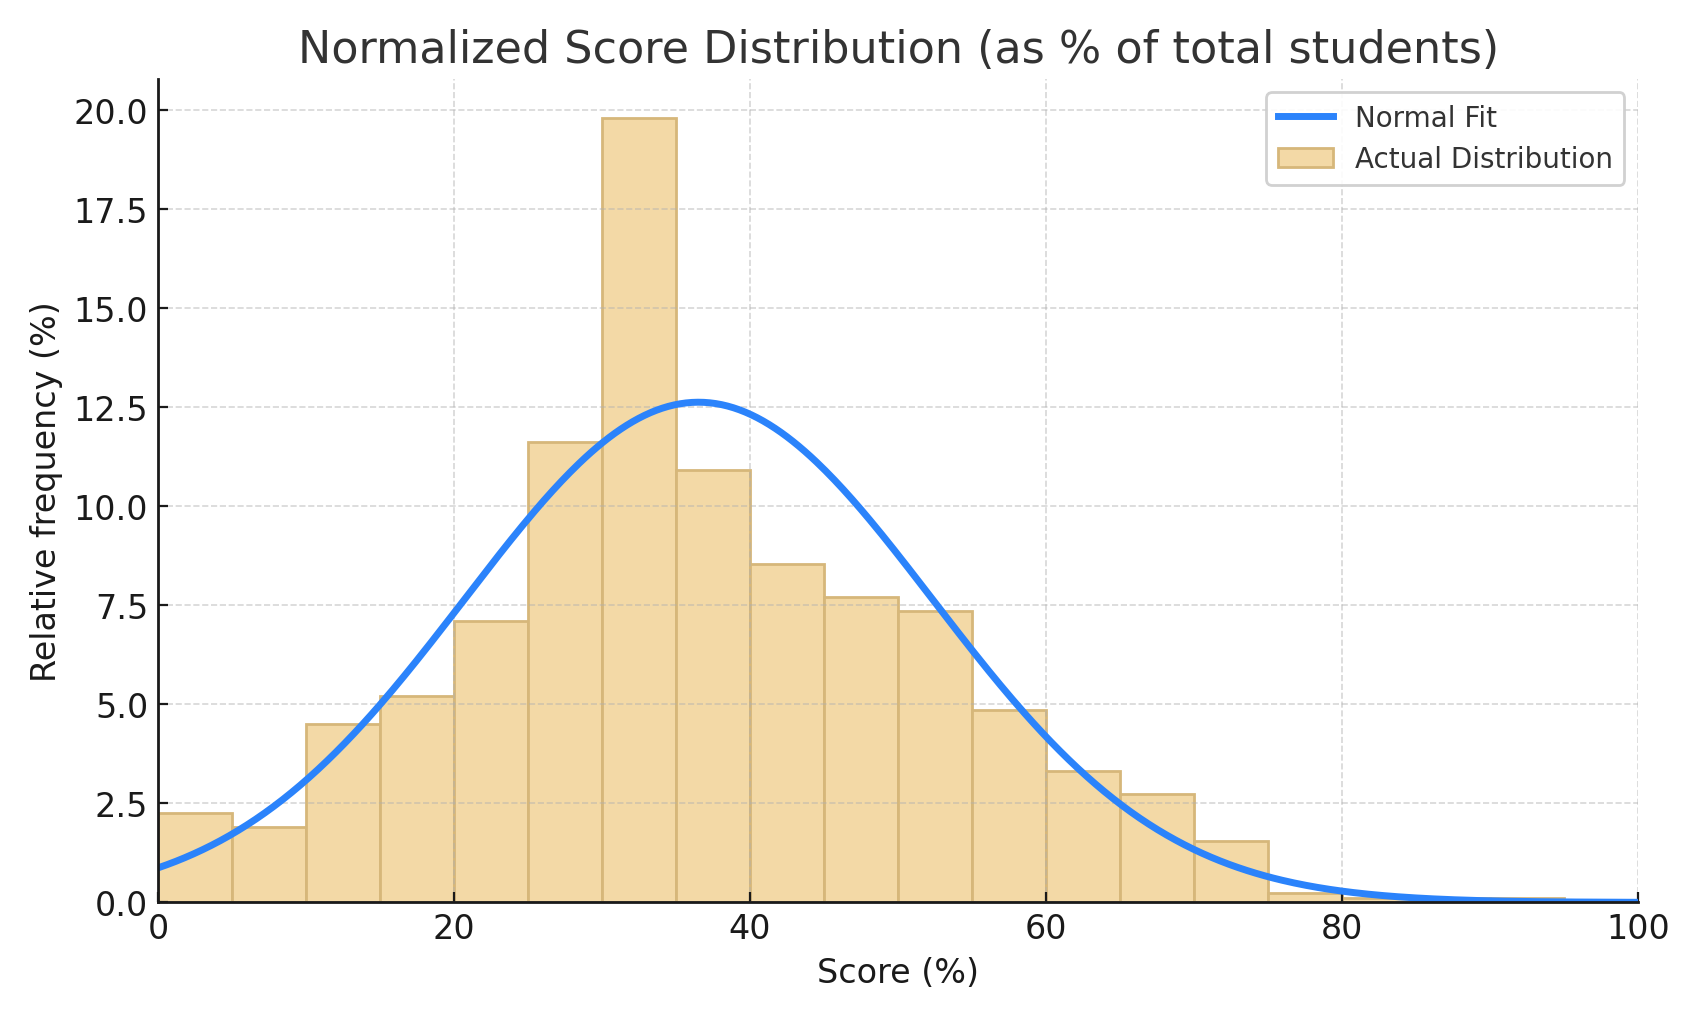
Bars show the proportion of students per score range; curve shows normal fit.
Grade 3 Top 10 Math Stars
| Rank | Student | School | City | Province/State | Country |
|---|---|---|---|---|---|
| 1 | Patricia N. | Holy Cross Catholic Elementary School | Lasalle | Ontario | Canada |
| 2 | Brian Y. | Holy Cross Catholic Elementary School | Lasalle | Ontario | Canada |
| 3 | Alex B. | Winston Churchill Public School | Kingston | Ontario | Canada |
| 4 | Maya Z. | BASIS Tucson Primary | Tucson | AZ | USA |
| 5 | Aung P. | Janet Johnstone | Millrise | Alberta | Canada |
| 6 | Reyaansh V. | Math Competition Coaching | Ashburn | VA | USA |
| 7 | Ayansh K. | Sandwich West Public School | Lasalle | Ontario | Canada |
| 8 | Max L. | New Horizons School | Sherwood Park | Alberta | Canada |
| 9 | Eva C. | Grattan Elementary School | San Francisco | CA | USA |
| 10 | Jordan U. | Elizabeth Ziegler Public School | Waterloo | Ontario | Canada |