Grade 1 National Score Analysis
Key percentile cutoffs and distribution overview for the October 2025 ICMC results.
Top 1%
≥ 75
Top 5%
≥ 65
Top 10%
≥ 60
Top 25%
≥ 50
Five-Number Summary
| Minimum | Q1 (25%) | Median | Q3 (75%) | Maximum |
|---|---|---|---|---|
| 0 | 30 | 40 | 50 | 90 |
Normalized Score Distribution
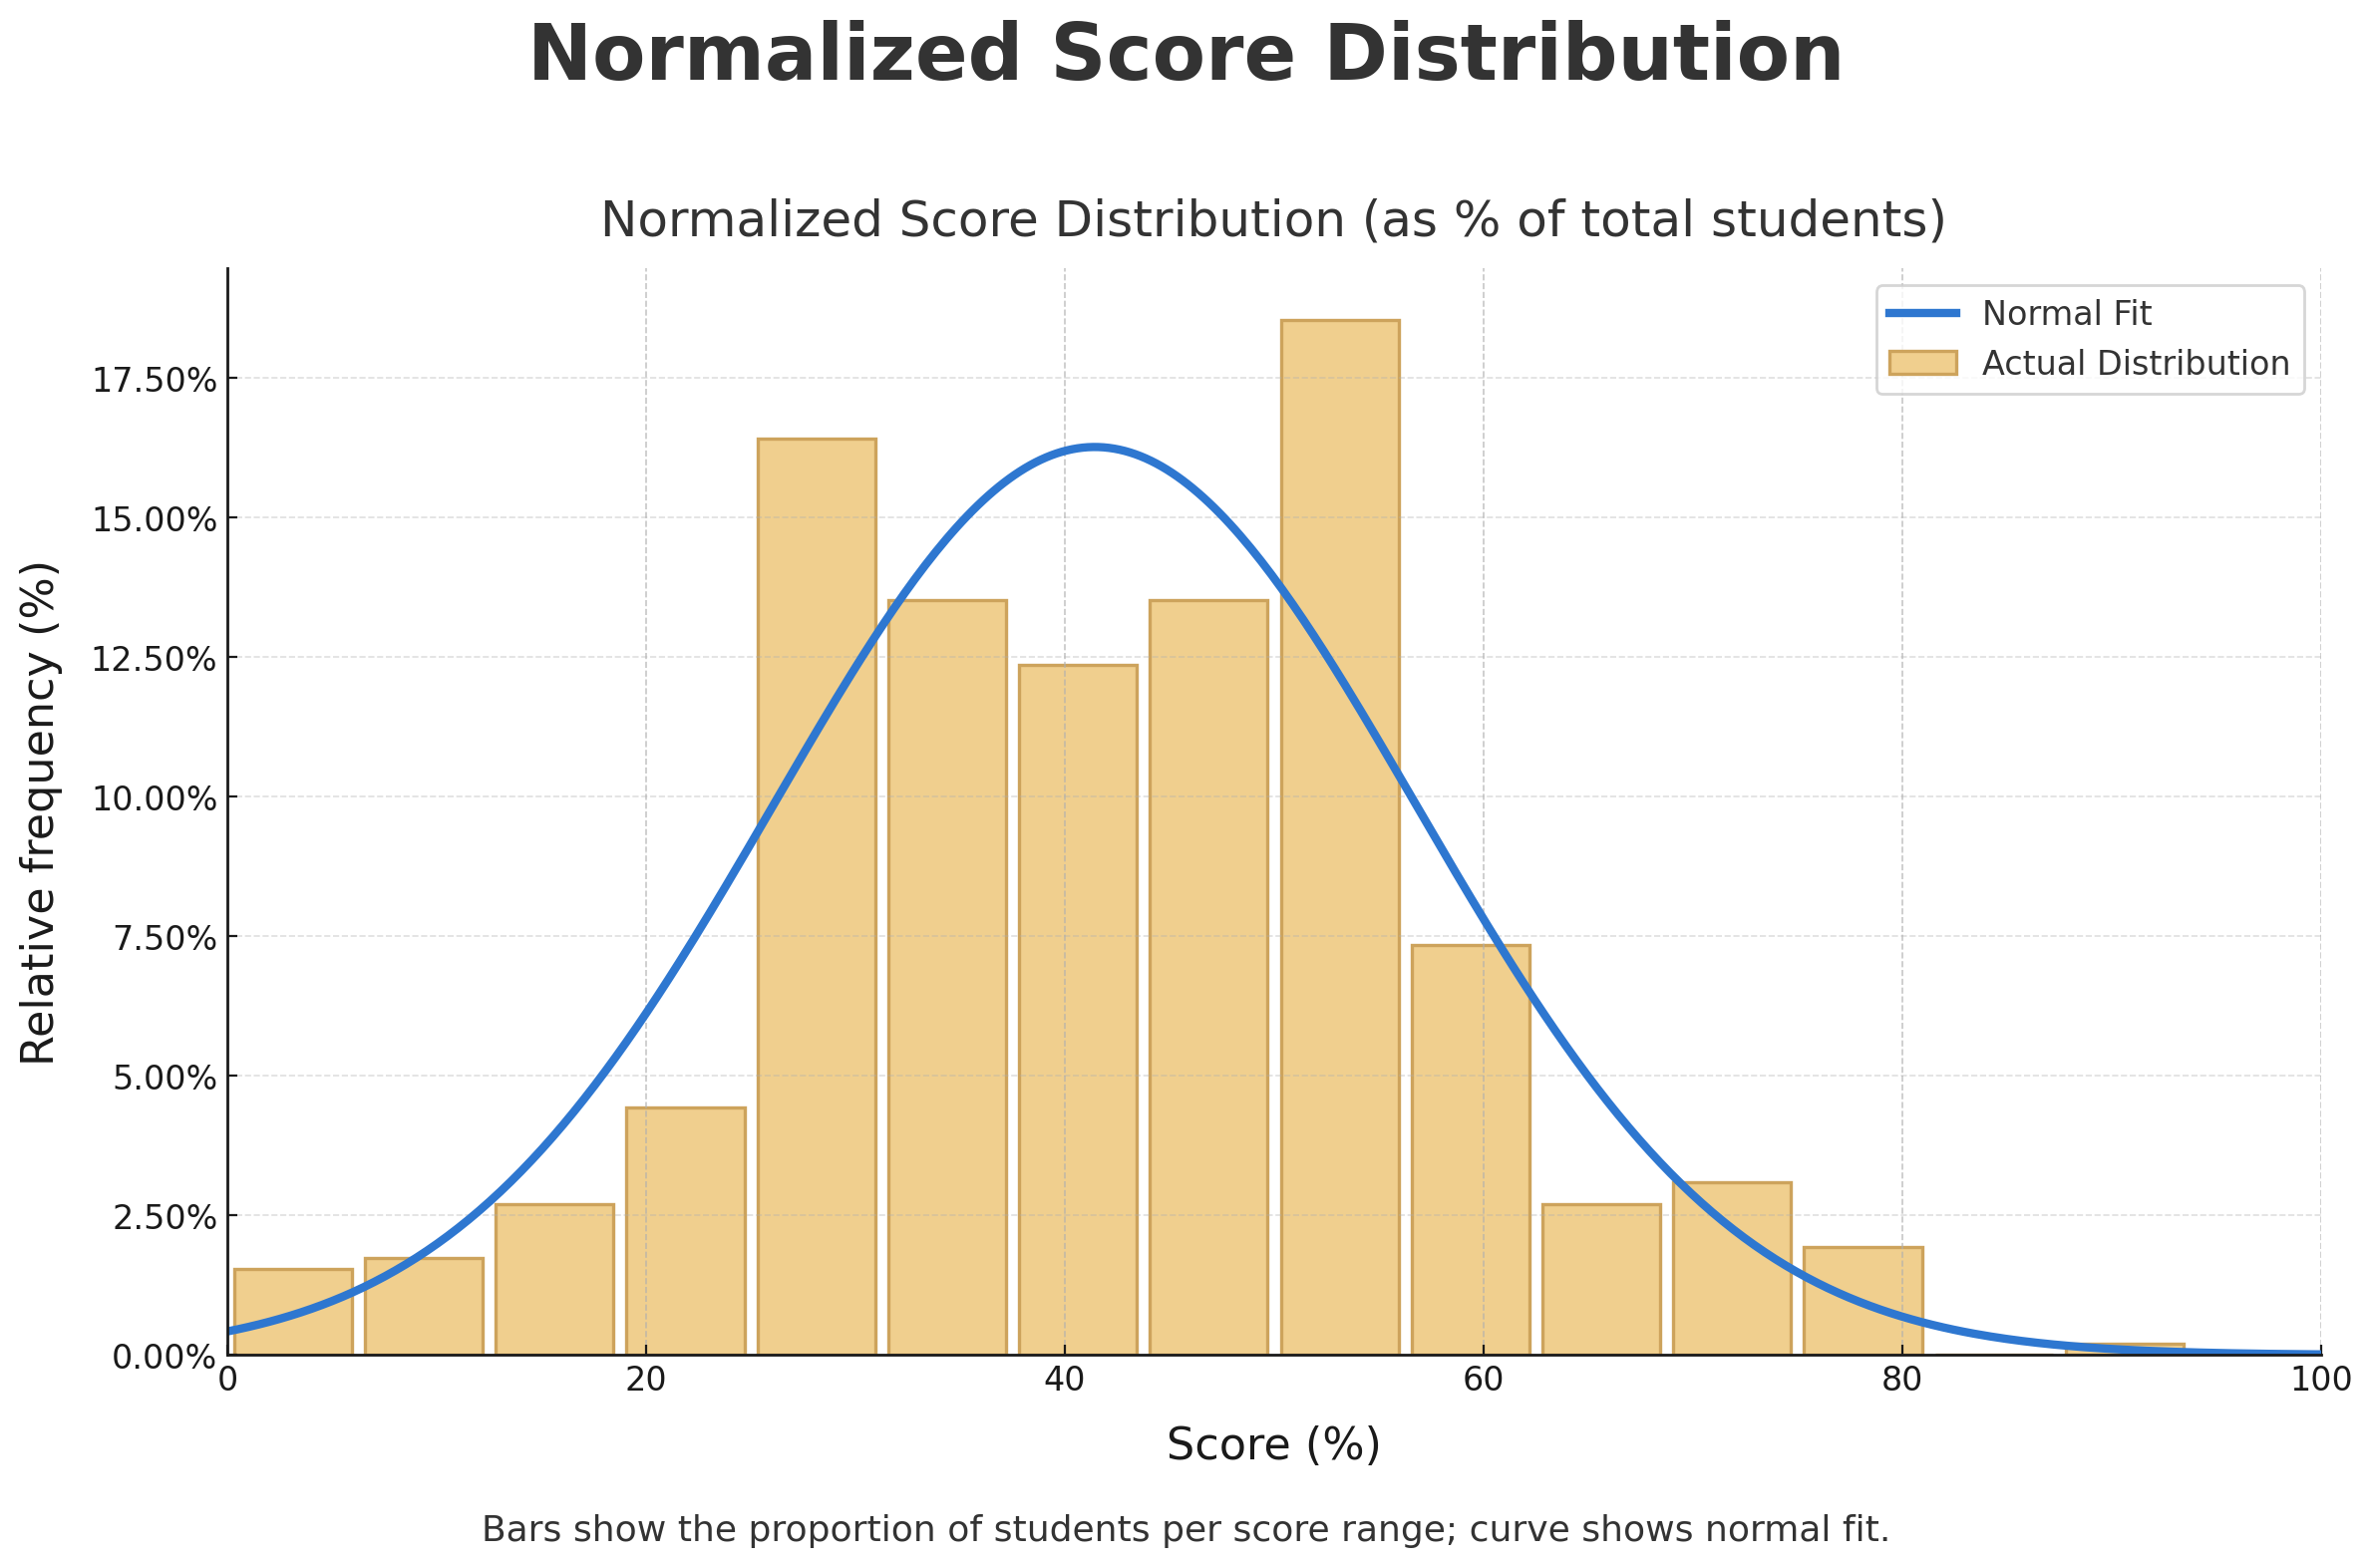
Bars show the proportion of students per score range; curve shows normal fit.
Grade 1 Top 10 Math Stars
| Rank | Student | School | City | Province/State | Country |
|---|---|---|---|---|---|
| 1 | Bohan S. | St. Joseph Catholic Elementary School | River Canard | Ontario | Canada |
| 2 | Nathan Z. | NA | Aurora | Ontario | Canada |
| 3 | Aaron X. | Central Public School | Windsor | Ontario | Canada |
| 4 | Selina L. | Stittsville Public School | Ottawa | Ontario | Canada |
| 5 | Ayden A. | New Horizons School | Sherwood Park | Alberta | Canada |
| 6 | Liam W. | Lakeside Public School | Keswick | Ontario | Canada |
| 7 | Aurora K. | Aurora Academy | Guelph | Ontario | Canada |
| 8 | Lucas M. | Bayview Hill Elementary School | Richmond Hill | Ontario | Canada |
| 9 | Maya C. | Hawthorn Elementary School | Dartmouth | Nova Scotia | Canada |
| 10 | Ella J. | Maple Grove Elementary | Oakville | Ontario | Canada |